
|
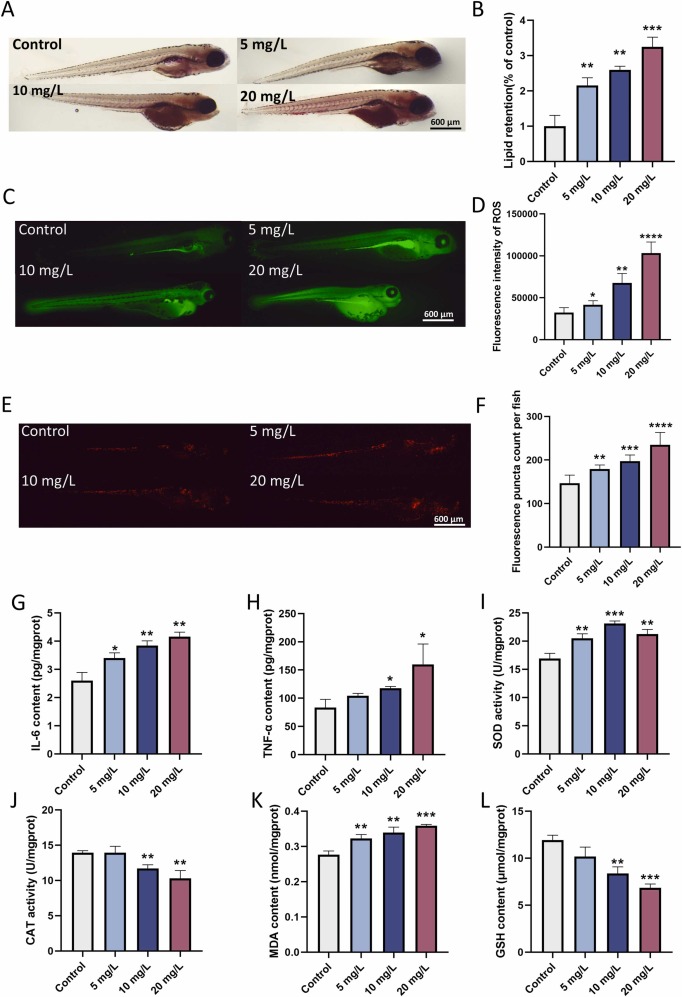
Fig. 2 ADB-FUBINACA induces lipid dyshomeostasis (A–B), inflammation (E–H) and oxidative stress (C–D, I–L) in zebrafish embryos. (A) Representative images after continued exposure to 5–20 mg/L of ADB-FUBINACA. (B) Relative retention of yolk lipid. (C) Representative images of fluorescence distribution of ROS in embryos. (D) Relative ROS fluorescence intensity. (E) Representative fluorescence images of Tg (lyz: DsRed) of transgenic zebrafish. (F) Fluorescence puncta count per fish. (G) Content of IL-6. (G) Content of TNF-α. (I) SOD activities. (J) CAT activities. (K) Content of MDA. (L) Content of GSH. The data were presented as mean ± S.D. of three independent experiments (n = 30). * p < 0.05, ** p < 0.01, *** p < 0.001, **** p < 0.0001.