
FIGURE
Fig. 4
- ID
- ZDB-FIG-251006-15
- Publication
- Luo et al., 2025 - Toxicological effects of ADB-FUBINACA on early zebrafish development: An analysis utilizing metabolomics
- Other Figures
- All Figure Page
- Back to All Figure Page
Fig. 4
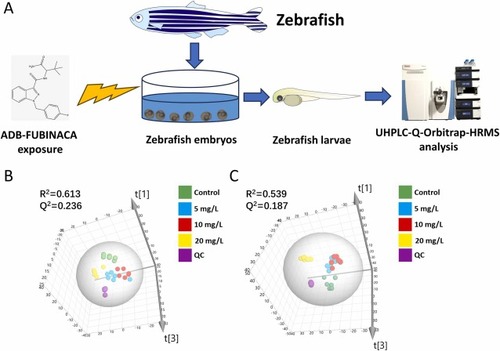
ADB-FUBINACA exposure causes metabolic disorders in zebrafish. (A) Flow chart of the ADB-FUBINACA exposure experiment. (B) 3D PCA score plot in negative mode. (C) 3D PCA score plot in positive mode. In the PCA model. In the 3D PCA model, different colors were used to represent the different groups: green for the control group, blue for the 5 mg/L of ADB-treated group, red for the 10 mg/L of ADB-treated group, yellow for the 20 mg/L of ADB-treated, and purple for the QC group. |
Expression Data
Expression Detail
Antibody Labeling
Phenotype Data
Phenotype Detail
Acknowledgments
This image is the copyrighted work of the attributed author or publisher, and
ZFIN has permission only to display this image to its users.
Additional permissions should be obtained from the applicable author or publisher of the image.
Full text @ Ecotoxicol. Environ. Saf.