
Fig. 6
- ID
- ZDB-FIG-251006-17
- Publication
- Luo et al., 2025 - Toxicological effects of ADB-FUBINACA on early zebrafish development: An analysis utilizing metabolomics
- Other Figures
- All Figure Page
- Back to All Figure Page
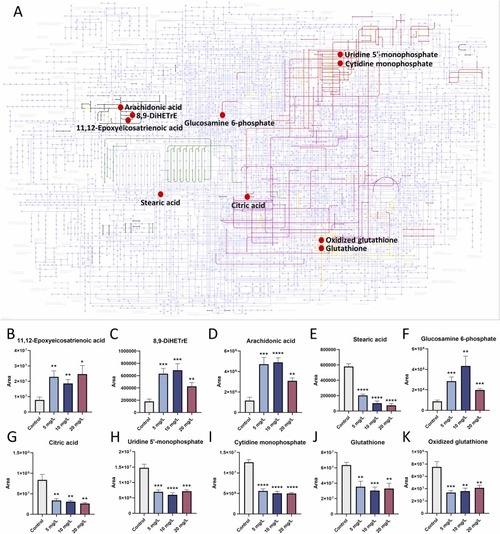
Global pathway network and key differential metabolites analysis by MetaboAnalyst 6.0. (A) The global metabolic pathway network. Significant metabolites are represented by red points, biosynthesis of unsaturated fatty acids by green lines, arachidonic acid metabolism by black lines, alanine, aspartate and glutamate metabolism by purple lines, glutathione metabolism by yellow lines, and pyrimidine metabolism by red lines. (B-K) The relative detected peak area of important metabolites in the global KEGG network. The data were presented as mean ± S.D. from six replicates for each treatment (n = 30). * p < 0.05, ** p < 0.01, *** p < 0.001, **** p < 0.0001. |