
|
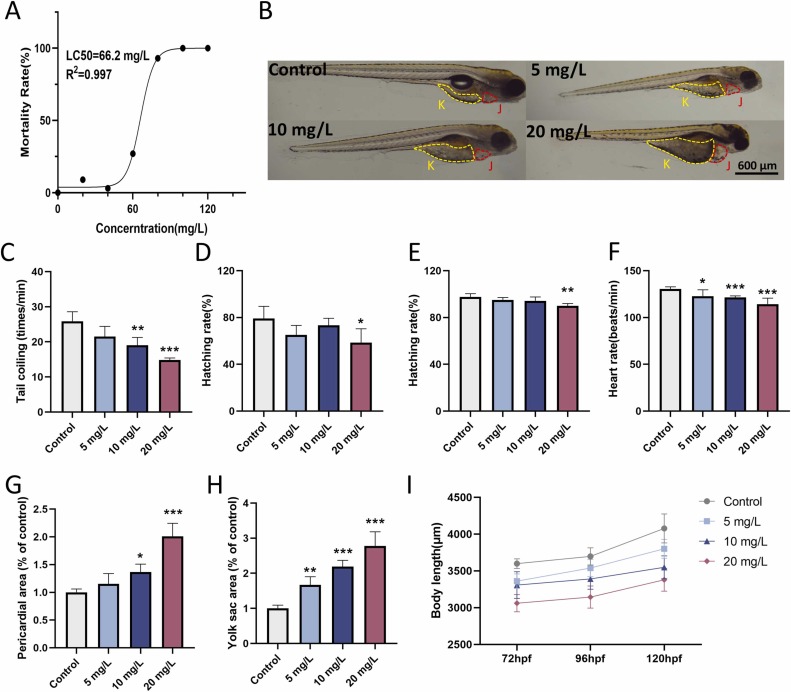
Fig. 1 The impact of ADB-FUBINACA exposure on the developmental toxicity of zebrafish embryos. (A) The mortality rates. (B) Representative embryo images at 120 hpf, which shows that " J " and " K " represent the heart and yolk sac respectively. (C) Tail coiling frequency at 24 hpf. (D) Hatching rate at 48 hpf. (E) Hatching rate at 72 hpf. (F) Heart rate at 120 hpf. (G) The area of pericardial at 120 hpf. (H) Yolk sac area at 120 hpf. (I) Body length at 72, 96, and 120 hpf with ADB-FUBINACA exposure. The data were presented as mean ± S.D. of 12 zebrafish embryos for each treatment. * p < 0.05, ** p < 0.01, *** p < 0.001.