
- Title
-
A subset of neutrophil phagosomes is characterised by pulses of Class I PI3K activity
- Authors
- Muir, C.F., Reyes-Aldasoro, C.C., Prajsnar, T.K., Michno, B.J., Cholewa-Waclaw, J., Ho, Y.X., Bernut, A., Loynes, C.A., Elworthy, S., Bowden, K.A., Cadby, A.J., Prince, L.R., King, J.S., Ellett, F., Condliffe, A.M., Renshaw, S.A.
- Source
- Full text @ Dis. Model. Mech.
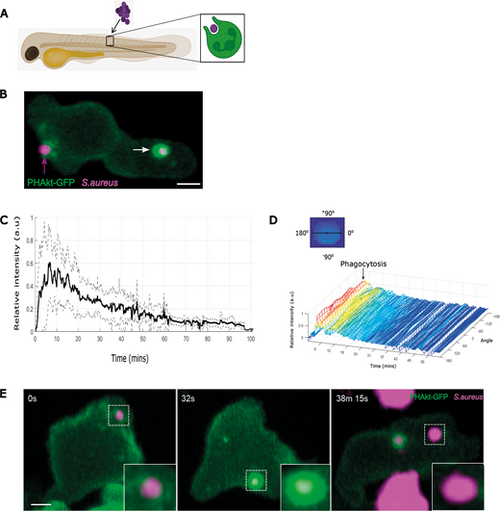
Dynamics of PHAkt-eGFP on neutrophil phagosomes. (A) Schematic illustrating localised somite injection of S. aureus into day 3 Tg(lyz:PHAkt-EGFP)i277 zebrafish larvae. (B) Image from a timelapse capturing a neutrophil phagocytosing pHrodo™ Red-labelled S. aureus (magenta; magenta arrow) and strong recruitment of PHAkt-eGFP (green) to the phagosome after cup closure (white arrow). Scale bar: 2 µm. (C) Quantification of PHAkt-eGFP fluorescence on the phagosome membrane during phagocytosis of pHrodo™ Red-labelled S. aureus. Data shown are the average intensity values of nine phagosomes from four independent larvae, from four experiments±s.d. a.u., arbitrary units. (D) Quantification of PHAkt-eGFP fluorescence on the phagosome membrane over time. Graphic illustrates how intensity values around the phagosome membrane ('angle') were measured. (E) Sequential images illustrating PHAkt-eGFP recruitment to a neutrophil phagosome. Large clusters of strongly acidified bacteria are present within adjacent unlabelled, presumed macrophages. Scale bar: 2 µm. |
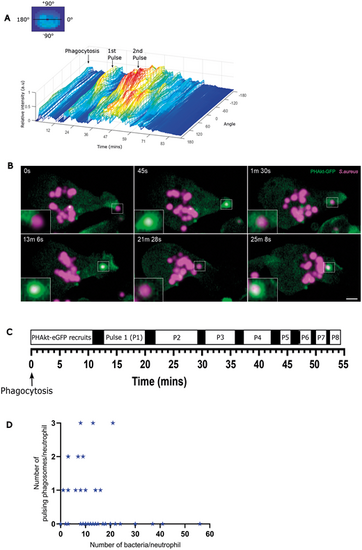
PHAkt-eGFP recruits in pulsatile bursts to neutrophil phagosomes. (A) Quantification of PHAkt-eGFP fluorescence on a pulsing phagosome. Graphic illustrates how intensity values around the phagosome membrane (‘angle’) were measured. (B) Sequential images of a pulsing phagosome. 0 s, start of phagocytosis; 45 s, surge of PHAkt-eGFP recruitment as the phagosome closes; 1 min 30 s, PHAkt-eGFP diminishes from the phagosome; 13 min 6 s, 1st pulse; 21 min 28 s, loss of PHAkt-eGFP recruitment; 25 min 8 s, 2nd pulse. Scale bar: 2 µm. (C) Schematic illustrating pulsatile recruitment of PHAkt-eGFP to phagosomes. Data represent average values from 152 phagosomes, from 11 independent larvae, from 11 experiments. (D) Pulses occur irrespective of the number of bacteria within a neutrophil. Data shown are from 55 neutrophils, from 11 independent larvae, from 11 experiments. Spearman's rank correlation between the number of pulsing phagosomes per neutrophil and the number of bacteria per neutrophil, was −0.2733; P=0.0415. |
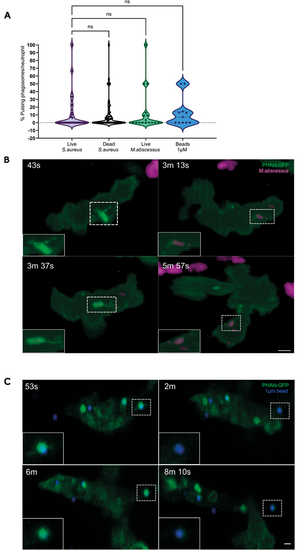
Pulsatile bursts of PHAkt-eGFP recruitment are a neutrophil response to prey. (A) Violin plot showing the percentage of pulsing phagosomes per phagocytic neutrophil for live and dead S. aureus, live M. abscessus and 1 µm beads. Data shown are the median with the 25th and 75th percentiles. Live S. aureus, 46 phagosomes analysed from 11 independent larvae, from 11 experiments; dead S. aureus, 54 phagosomes, ten independent larvae, from ten experiments; live M. abscessus, 18 phagosomes, six independent larvae, six experiments; 1 µm beads, 11 phagosomes, four independent larvae, four experiments. ns, not significant (Kruskal–Wallis test). (B) ‘Pulses’ occur on phagosomes containing M. abscessus. PHAkt-eGFP recruits to phagosomes during phagocytosis (43 s) before gradually diminishing (3 min 13 s). PHAkt-eGFP then re-recruits to the phagosome (1st pulse; 3 min 37 s) and then diminishes again (5 min 57 s). Scale bar: 2 µm. (C) Pulses occur on phagosomes containing 1 µm beads. PHAkt-eGFP recruits to phagosomes during phagocytosis (53 s) before gradually diminishing (2 min). PHAkt-eGFP then re-recruits to the phagosome (1st pulse; 6 min) and then diminishes again (8 min 10 s). Phagocytosis starts at 0 min. Scale bar: 1 µm. |
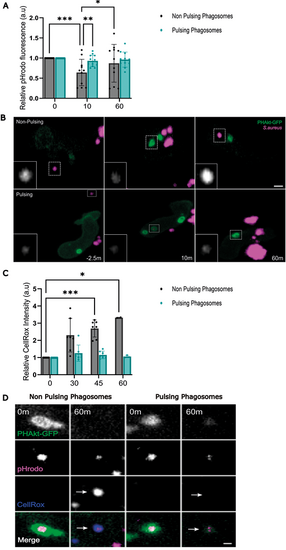
pH change in pulsing phagosomes differs from that in non-pulsing phagosomes. (A) Quantification of the relative change in fluorescence of pHrodo-stained S. aureus in non-pulsing versus pulsing phagosomes. Data shown are the mean±s.d. 0 min, 12 non-pulsing phagosomes, 14 pulsing phagosomes; 10 min, 11 non-pulsing phagosomes, 13 pulsing phagosomes; 60 min, 11 non-pulsing phagosomes, 12 pulsing phagosomes, 11 independent larvae, 11 experiments. (B) Sequential timelapse images comparing the change in fluorescence of pHrodo-stained S. aureus in pulsing versus non-pulsing phagosomes. Scale bars: 2 µm. (C) Quantification of the relative change in CellROX™ fluorescence within non-pulsing versus pulsing phagosomes. Data shown are the mean±s.d. 0 min, seven non-pulsing phagosomes, seven pulsing phagosomes; 30 min, seven non-pulsing phagosomes, seven pulsing phagosomes; 45 min, seven non-pulsing phagosomes, seven pulsing phagosomes; 60 min, two non-pulsing phagosomes, three pulsing phagosomes; from four independent larvae, from four experiments. (D) Sequential images illustrating changes in CellROX™ fluorescence within non-pulsing versus pulsing phagosomes. Arrows indicate bright fluorescence of CellROX in a non-pulsing phagosome vs absence of fluorescent CellROX within a pulsing phagosome, 60 min after phagocytosis. Scale bar: 1 µm. *P<0.05, **P<0.005, ***P<0.001 (mixed-effects model with multiple comparisons). |
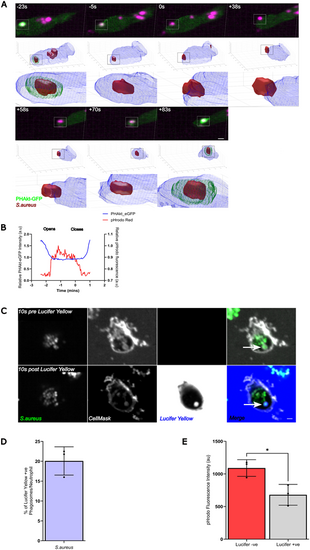
A subset of neutrophil phagosomes may remain unsealed. (A) Sequential images and 3D reconstruction of PHAkt-eGFP dynamics when S. aureus is within a phagosome (−23 s), the phagosome re-opens (0 s) and then re-closes (+70 s). Scale bar: 2 µm. (B) Quantification of the change in PHAkt-eGFP fluorescence of pHrodo-stained S. aureus when a neutrophil phagosome re-opens and closes. (C) Images illustrating the accumulation of Lucifer Yellow in a formed human neutrophil phagosome (arrows). There was a 20 s delay between imaging, adding Lucifer Yellow and then re-commencing imaging as we needed to unload the plate from the microscope to add the dye. Scale bar: 1 µm. (D) Quantification of the percentage of Lucifer Yellow+ phagosomes in human neutrophils at 30 months post infection (mpi). Data shown are the mean±s.d. of 2779 phagosomes analysed from three experiments. (E) Quantification of pHrodo fluorescence in Lucifer Yellow− versus Lucifer Yellow+ phagosomes at 60 mpi. Data shown are the mean±s.d. of 4369 phagosomes analysed from three experiments. *P<0.05 (unpaired t-test). |
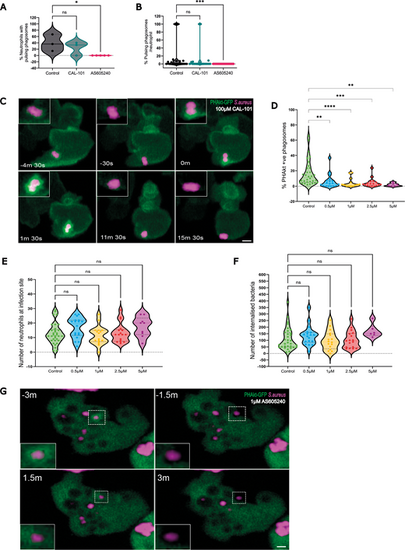
Pulses of PHAkt occur despite inhibition with CAL-101 and are abolished by AS605240. (A) Violin plot showing the percentage of neutrophils that have pulsing phagosomes. Timelapse started 2 h post infection following 30 min incubation of Tg(lyz:PHAkt-EGFP)i277 larvae with 100 µm CAL-101 and 1 µm AS605240. Data shown are the median with the 25th and 75th percentiles from 87 neutrophils, 11 independent larvae, 11 experiments. (B) Violin plot showing the percentage of pulsing phagosomes in each neutrophil in a timelapse starting 2 h post infection following 30 min incubation of Tg(lyz:PHAkt-eGFP)i277 larvae with 100 µm CAL-101 and 1 µm AS605240. Data shown are the median with the 25th and 75th percentiles from 780 phagosomes, 11 independent larvae, 11 experiments. (C) Sequential images illustrating pulsatile recruitment of PHAkt-eGFP to a phagosome exposed to 100 µm CAL-101. Scale bar: 2 µm. (D) Violin plot showing quantification of the percentage of PHAkt-eGFP+ phagosomes 2 h post infection following 30 min incubation with AS605240. Data shown are the median with the 25th and 75th percentiles from six independent larvae, from six experiments. (E) Violin plot showing quantification of the number of neutrophils at a S. aureus infection site 2 h post infection following 30 min incubation with AS605240. Data shown are the median with the 25th and 75th percentiles from six independent larvae, six experiments. (F) Violin plot showing quantification of the number of bacteria/neutrophils 2 h post infection following 30 min incubation with AS605240. Data shown are the median with the 25th and 75th percentiles from six independent larvae, six experiments. (G) Sequential images illustrating that PHAkt-eGFP recruits to neutrophil phagosomes prior to exposure to 1 µm AS605240 (3 min before attempted re-phagocytosis (−3 min). Bacteria are then released from the phagosome (−1.5 min). Following exposure to 1 µm AS605240, the neutrophil attempts to re-phagocytose the bacteria, but PHAkt-eGFP does not recruit to the phagosome (1.5 min), and the bacteria are released from the phagosome (3 min). Scale bar: 2 µm. *P<0.05, **P<0.005, ***P<0.001, ****P<0.0001 (Kruskal–Wallis with multiple comparisons). |