
|
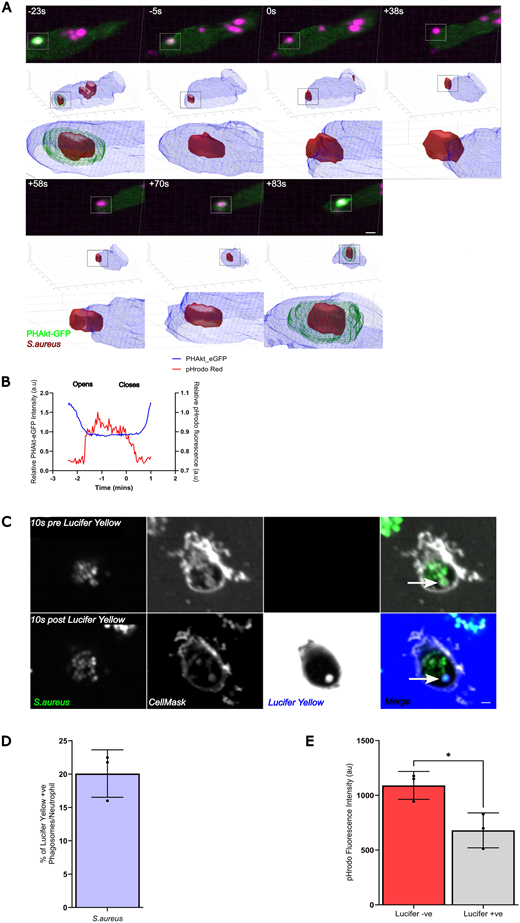
Fig. 5 A subset of neutrophil phagosomes may remain unsealed. (A) Sequential images and 3D reconstruction of PHAkt-eGFP dynamics when S. aureus is within a phagosome (−23 s), the phagosome re-opens (0 s) and then re-closes (+70 s). Scale bar: 2 µm. (B) Quantification of the change in PHAkt-eGFP fluorescence of pHrodo-stained S. aureus when a neutrophil phagosome re-opens and closes. (C) Images illustrating the accumulation of Lucifer Yellow in a formed human neutrophil phagosome (arrows). There was a 20 s delay between imaging, adding Lucifer Yellow and then re-commencing imaging as we needed to unload the plate from the microscope to add the dye. Scale bar: 1 µm. (D) Quantification of the percentage of Lucifer Yellow+ phagosomes in human neutrophils at 30 months post infection (mpi). Data shown are the mean±s.d. of 2779 phagosomes analysed from three experiments. (E) Quantification of pHrodo fluorescence in Lucifer Yellow− versus Lucifer Yellow+ phagosomes at 60 mpi. Data shown are the mean±s.d. of 4369 phagosomes analysed from three experiments. *P<0.05 (unpaired t-test).