
|
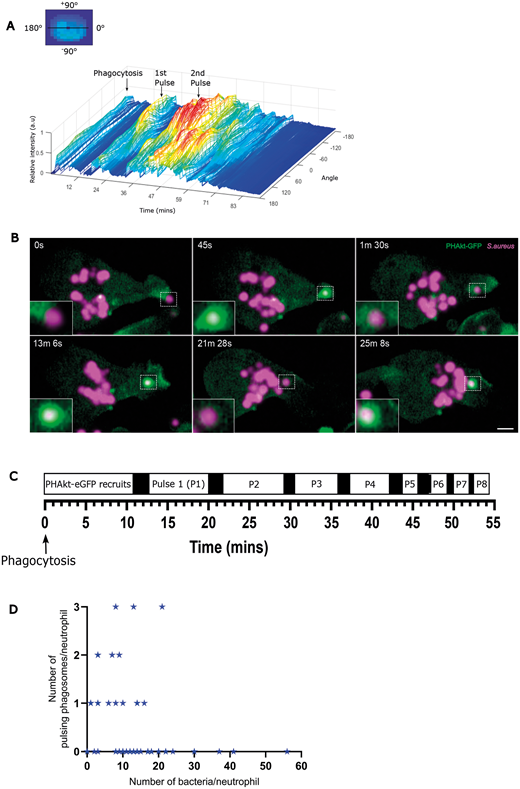
Fig. 2 PHAkt-eGFP recruits in pulsatile bursts to neutrophil phagosomes. (A) Quantification of PHAkt-eGFP fluorescence on a pulsing phagosome. Graphic illustrates how intensity values around the phagosome membrane (‘angle’) were measured. (B) Sequential images of a pulsing phagosome. 0 s, start of phagocytosis; 45 s, surge of PHAkt-eGFP recruitment as the phagosome closes; 1 min 30 s, PHAkt-eGFP diminishes from the phagosome; 13 min 6 s, 1st pulse; 21 min 28 s, loss of PHAkt-eGFP recruitment; 25 min 8 s, 2nd pulse. Scale bar: 2 µm. (C) Schematic illustrating pulsatile recruitment of PHAkt-eGFP to phagosomes. Data represent average values from 152 phagosomes, from 11 independent larvae, from 11 experiments. (D) Pulses occur irrespective of the number of bacteria within a neutrophil. Data shown are from 55 neutrophils, from 11 independent larvae, from 11 experiments. Spearman's rank correlation between the number of pulsing phagosomes per neutrophil and the number of bacteria per neutrophil, was −0.2733; P=0.0415.