
Fig. 4
- ID
- ZDB-FIG-250916-41
- Publication
- Muir et al., 2025 - A subset of neutrophil phagosomes is characterised by pulses of Class I PI3K activity
- Other Figures
- All Figure Page
- Back to All Figure Page
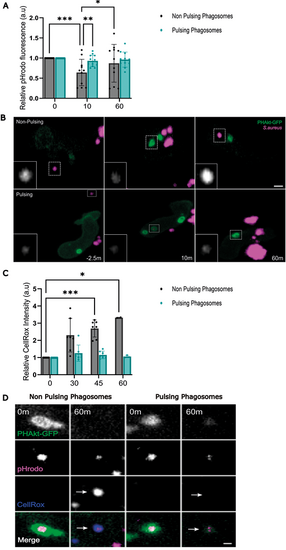
pH change in pulsing phagosomes differs from that in non-pulsing phagosomes. (A) Quantification of the relative change in fluorescence of pHrodo-stained S. aureus in non-pulsing versus pulsing phagosomes. Data shown are the mean±s.d. 0 min, 12 non-pulsing phagosomes, 14 pulsing phagosomes; 10 min, 11 non-pulsing phagosomes, 13 pulsing phagosomes; 60 min, 11 non-pulsing phagosomes, 12 pulsing phagosomes, 11 independent larvae, 11 experiments. (B) Sequential timelapse images comparing the change in fluorescence of pHrodo-stained S. aureus in pulsing versus non-pulsing phagosomes. Scale bars: 2 µm. (C) Quantification of the relative change in CellROX™ fluorescence within non-pulsing versus pulsing phagosomes. Data shown are the mean±s.d. 0 min, seven non-pulsing phagosomes, seven pulsing phagosomes; 30 min, seven non-pulsing phagosomes, seven pulsing phagosomes; 45 min, seven non-pulsing phagosomes, seven pulsing phagosomes; 60 min, two non-pulsing phagosomes, three pulsing phagosomes; from four independent larvae, from four experiments. (D) Sequential images illustrating changes in CellROX™ fluorescence within non-pulsing versus pulsing phagosomes. Arrows indicate bright fluorescence of CellROX in a non-pulsing phagosome vs absence of fluorescent CellROX within a pulsing phagosome, 60 min after phagocytosis. Scale bar: 1 µm. *P<0.05, **P<0.005, ***P<0.001 (mixed-effects model with multiple comparisons). |