
|
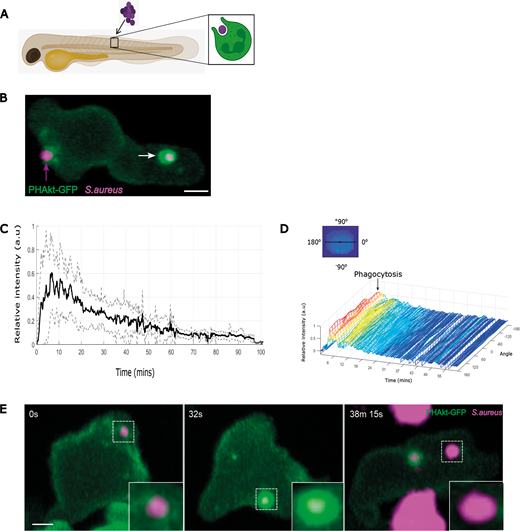
Fig. 1 Dynamics of PHAkt-eGFP on neutrophil phagosomes. (A) Schematic illustrating localised somite injection of S. aureus into day 3 Tg(lyz:PHAkt-EGFP)i277 zebrafish larvae. (B) Image from a timelapse capturing a neutrophil phagocytosing pHrodo™ Red-labelled S. aureus (magenta; magenta arrow) and strong recruitment of PHAkt-eGFP (green) to the phagosome after cup closure (white arrow). Scale bar: 2 µm. (C) Quantification of PHAkt-eGFP fluorescence on the phagosome membrane during phagocytosis of pHrodo™ Red-labelled S. aureus. Data shown are the average intensity values of nine phagosomes from four independent larvae, from four experiments±s.d. a.u., arbitrary units. (D) Quantification of PHAkt-eGFP fluorescence on the phagosome membrane over time. Graphic illustrates how intensity values around the phagosome membrane ('angle') were measured. (E) Sequential images illustrating PHAkt-eGFP recruitment to a neutrophil phagosome. Large clusters of strongly acidified bacteria are present within adjacent unlabelled, presumed macrophages. Scale bar: 2 µm.