
- Title
-
Guardian of myelin and neural Integrity: foxo1a through slc7a11 mitigating oxidative damage in myelin
- Authors
- Zhao, Y., Li, Z., Lu, W.
- Source
- Full text @ Redox Biol.
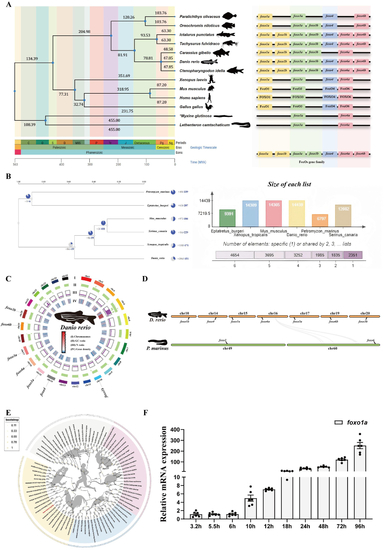
Phylogenetic tree of divergence times and expansion of gene families. A: Evolutionary analysis of FoxO divergence times, showing the distribution of FoxO gene families in different species. B: Analysis of gene family expansion, with a significant expansion of the FoxO gene family. C: Distribution of FoxO gene family members on zebrafish chromosomes. D: Synteny analysis between zebrafish and lamprey. E: Phylogenetic tree of the FoxO family proteins. F: Early expression of the zebrafish |
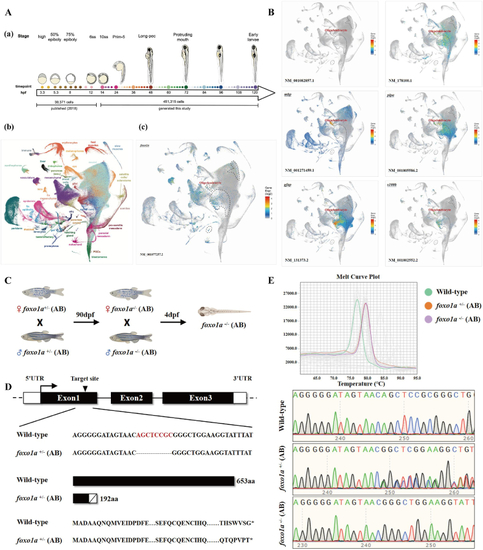
Spatiotemporal Expression and mutant Establishment of Zebrafish A: Single-cell RNA sequencing data of early zebrafish development, (a) high temporal resolution single-cell RNAseq time course, covering embryogenesis and early larval development. (b) UMAP projection of single-cell transcriptomes colored by selected major tissues. (c) B: Early developmental single-cell data of C: Schematic diagram of D: Schematic diagram of the E: HRMA of the |
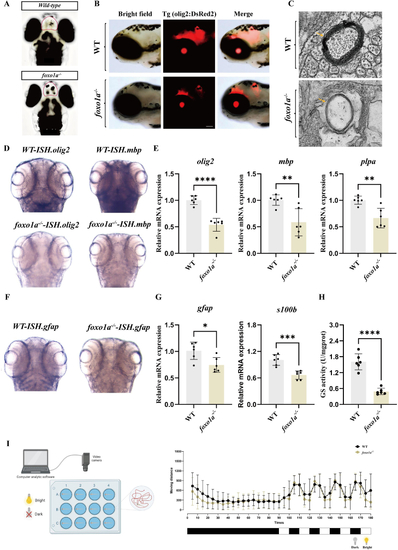
Mutant of the A: Dorsal view of the brains of control and B: Expression of C: Representative transmission electron micrographs of myelin in control and D: In situ hybridization of E: qRT-PCR analysis of F: In situ hybridization of G: Expression of H: Comparison of glutamine synthetase activity in control and I: Schematic of the light-dark alternation behavior experiment, where the Viewpoint tool observes zebrafish for 90 min under normal daylight, followed by minute-by-minute light-dark alternations, and records the distance moved by control and |
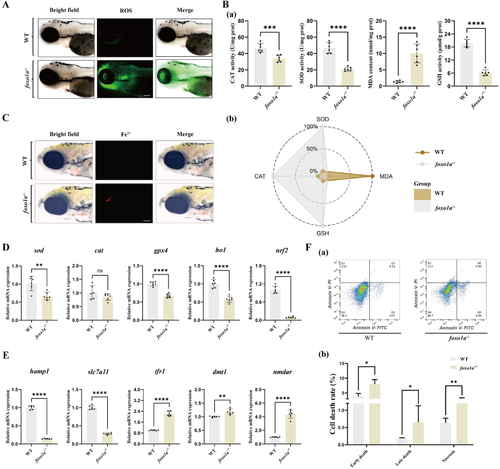
Deletion of the A: ROS fluorescence images of the brains of control group and B: (a) The effect of antioxidant enzyme activity in the brain tissue of control group and C: Iron ion fluorescence images of the brains of control group and D: qRT-PCR detection of changes in oxidative stress-related mRNA expression ( E: qRT-PCR detection of changes in ferroptosis-related gene mRNA expression of F: (a) Flow cytometry detection of apoptosis in the brains of control group and |
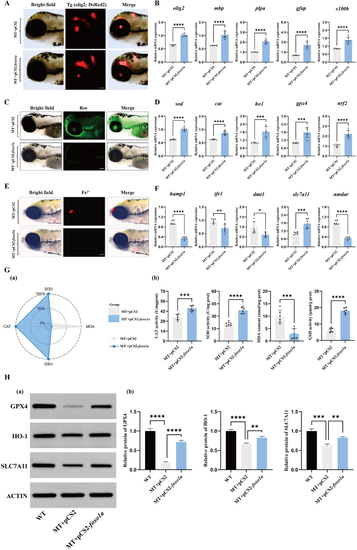
Overexpression of A: Fluorescent expression of B: Expression of C: ROS fluorescence in the brains of zebrafish larvae receiving empty vector and overexpressing D: qRT-PCR detection of antioxidant-related gene expression ( E: Fluorescence images of iron ions in the brains of zebrafish larvae receiving empty vector and overexpressing F: qRT-PCR detection of changes in mRNA expression of ferroptosis-related genes ( G: Effects of antioxidant enzyme activity in zebrafish larvae brain tissues, (a) IBR calculated star map of antioxidant enzyme activity in the brain tissues of control group and H: (a) Western blotting was used to detect changes in GPX4, HO-1, and SLC7A11 proteins in the brain tissue of the injection of the empty carrier wild-type zebrafish, the injection of the empty carrier mutant zebrafish, and the overexpression of |
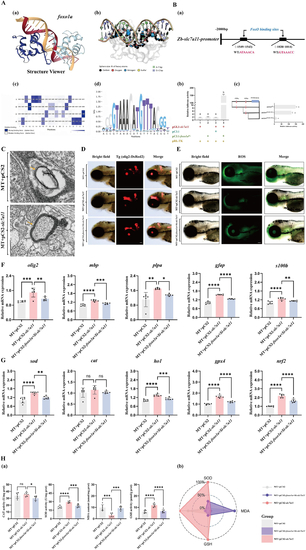
Transcription factor A: Prediction of transcription factor binding sites. (a) Schematic diagram of the binding of the B: (a) Analysis diagram of the specific binding sites of C: Representative transmission electron microscopy images of myelin in mutant zebrafish larvae injected with empty plasmid and in mutants overexpressing slc7a11. MT represents foxo1a mutant zebrafish.Yellow arrows indicate the location of the myelin, scale bar = 100 nm. D: Injecting null mutant, overexpressing E: Injecting empty vector mutants, overexpressing F: Injection of empty vector mutant, overexpression of G: Injecting empty vector mutants, overexpressing H: (a) Injection of empty vector |
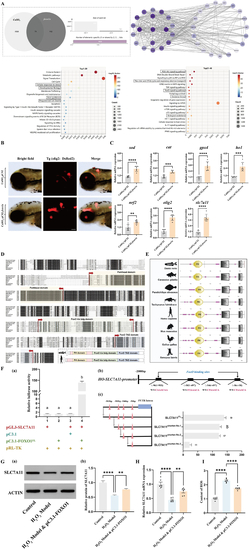
Application of A: Network molecular analysis results. (a) Venn diagram showing the number of common targets between B: C: mRNA expression levels of D: Protein sequence alignment of E: Structural analysis of representative proteins from the F: (a) pGL3 and pC3.1 represent the circular pGL3-basic plasmid and circular pcDNA3.1 (+) plasmid, respectively. The SLC7A11 gene promoter sequence was homologously recombined with the linearized pGL plasmid to construct the reporter plasmid pGL-SLC7A11. The full-length CDS sequence of FOXO1 was homologously recombined with the linearized pcDNA3.1 (+) plasmid to construct the expression plasmid pC3.1-FOXO1. The pRL-TK plasmid expressing rluc was co-transfected in each group to characterize transfection efficiency. The Arabic numerals near the x-axis indicate different treatment groups. Different letters indicate significant differences (P < 0.05). (b) Analysis diagram of the FOXO1-specific binding site on the SLC7A11 gene promoter. (c) Fragment deletion experiment of the transcriptional regulation of the SLC7A11 gene by transcription factor FOXO1. The pink triangles (△) represent FOXO1 transcription factor binding sites predicted by DeepPBS software. The four black horizontal lines represent the lengths of the promoter sequences in the reporter plasmids. They were obtained by homologous recombination of pGL3 basic plasmid fragments with SLC7A11 gene promoter sequences of different lengths. Different letters indicate significant differences (P < 0.05). G: (a) In human oligodendrocytes, the expression of SLC7A11 protein in the control group, the H2O2 model group, and the H2O2 model group with overexpressed FOXO1 was evaluated (b) the relative quantification of the SLC7A11 protein was performed using normalization, oneway ANOVA with Tukey's post-hoc test, ∗p < 0.05, ∗∗p < 0.01, ∗∗∗p < 0.001, ∗∗∗∗p < 0.0001. H: In human oligodendrocytes, the relative expression of SLC7A11 mRNA in the control group, H2O2 model group, and H2O2 model group overexpressing FOXO1, oneway ANOVA with Tukey's post-hoc test, N = 6 ∗ p < 0.05, ∗∗p < 0.01, ∗∗∗p < 0.001, ∗∗∗∗p < 0.0001. I: In human oligodendrocytes, the ROS levels in the control group, the H2O2 model group, and the H2O2 model group overexpressing FOXO1, oneway ANOVA with Tukey's post-hoc test, N = 6∗ p < 0.05, ∗∗p < 0.01, ∗∗∗p < 0.001, ∗∗∗∗p < 0.0001. |