Figure Caption
Fig. 5
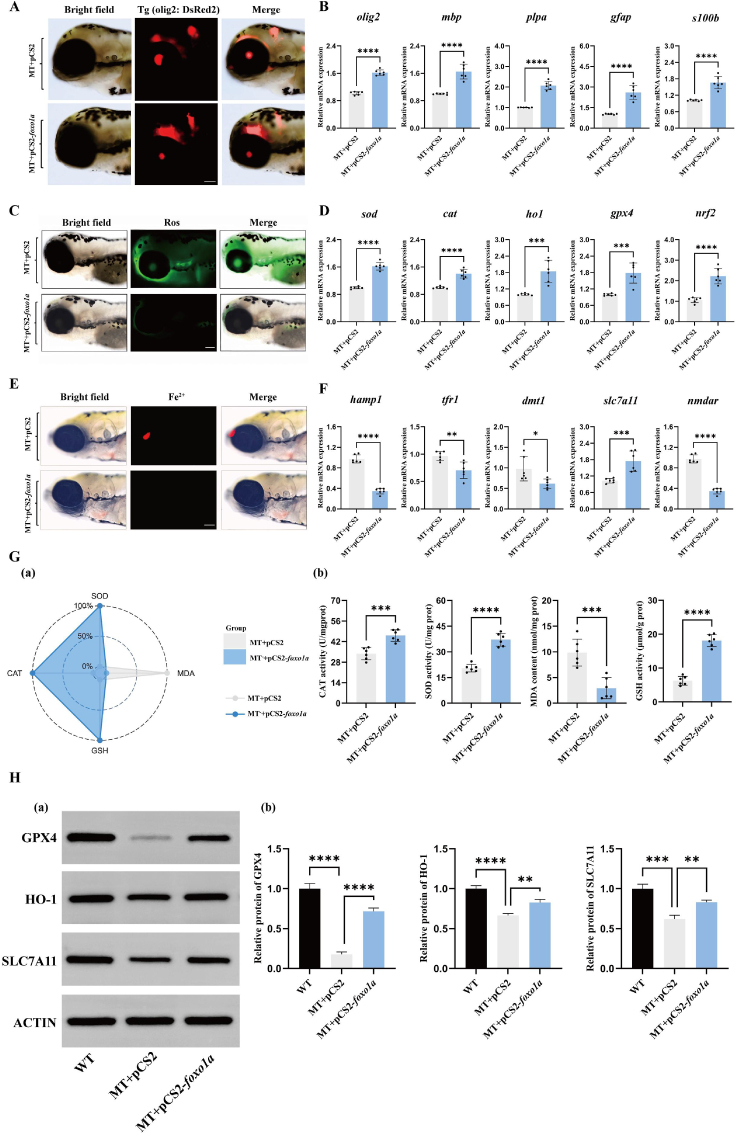
Overexpression of foxo1a rescues oligodendrocytes, reduces ROS levels, and alleviates ferroptosis.
A: Fluorescent expression of olig2 in the brains of zebrafish larvae receiving empty vector and overexpressing foxo1a, scale bar = 100 μm
B: Expression of olig2, mbp, plpa, gfap, and s100b oligodendrocyte-related genes in mutants receiving empty vector and overexpressing foxo1a, N = 6, t-test, ∗p < 0.05, ∗∗p < 0.01, ∗∗∗p < 0.001, ∗∗∗∗p < 0.0001.
C: ROS fluorescence in the brains of zebrafish larvae receiving empty vector and overexpressing foxo1a, scale bar = 100 μm.
D: qRT-PCR detection of antioxidant-related gene expression (sod, cat, ho1, gpx4 and nrf2) in the brain tissues of zebrafish larvae receiving empty vector and overexpressing foxo1a, N = 6, t-test, ∗p < 0.05, ∗∗p < 0.01, ∗∗∗p < 0.001, ∗∗∗∗p < 0.0001.
E: Fluorescence images of iron ions in the brains of zebrafish larvae receiving empty vector and overexpressing foxo1a, scale bar = 100 μm
F: qRT-PCR detection of changes in mRNA expression of ferroptosis-related genes (hamp1, tfr1, dmt1, slc7a11 and nmdar) in the brain tissues of zebrafish larvae receiving empty vector and overexpressing foxo1a, N = 6, t-test, ∗p < 0.05, ∗∗p < 0.01, ∗∗∗p < 0.001, ∗∗∗∗p < 0.0001.
G: Effects of antioxidant enzyme activity in zebrafish larvae brain tissues, (a) IBR calculated star map of antioxidant enzyme activity in the brain tissues of control group and foxo1a−/− group zebrafish larvae. (b) SOD activity, CAT activity, GSH activity and MDA content. N = 6, t-test, ∗p < 0.05, ∗∗p < 0.01, ∗∗∗p < 0.001, ∗∗∗∗p < 0.0001.
H: (a) Western blotting was used to detect changes in GPX4, HO-1, and SLC7A11 proteins in the brain tissue of the injection of the empty carrier wild-type zebrafish, the injection of the empty carrier mutant zebrafish, and the overexpression of foxo1a mutant zebrafish. MT represents the foxo1a mutant, (b) followed by normalization for relative protein quantification, oneway ANOVA with Tukey's post-hoc test, ∗p < 0.05, ∗∗p < 0.01, ∗∗∗p < 0.001, ∗∗∗∗p < 0.0001.
Acknowledgments
This image is the copyrighted work of the attributed author or publisher, and
ZFIN has permission only to display this image to its users.
Additional permissions should be obtained from the applicable author or publisher of the image.
Full text @ Redox Biol.