Figure Caption
Fig. 6
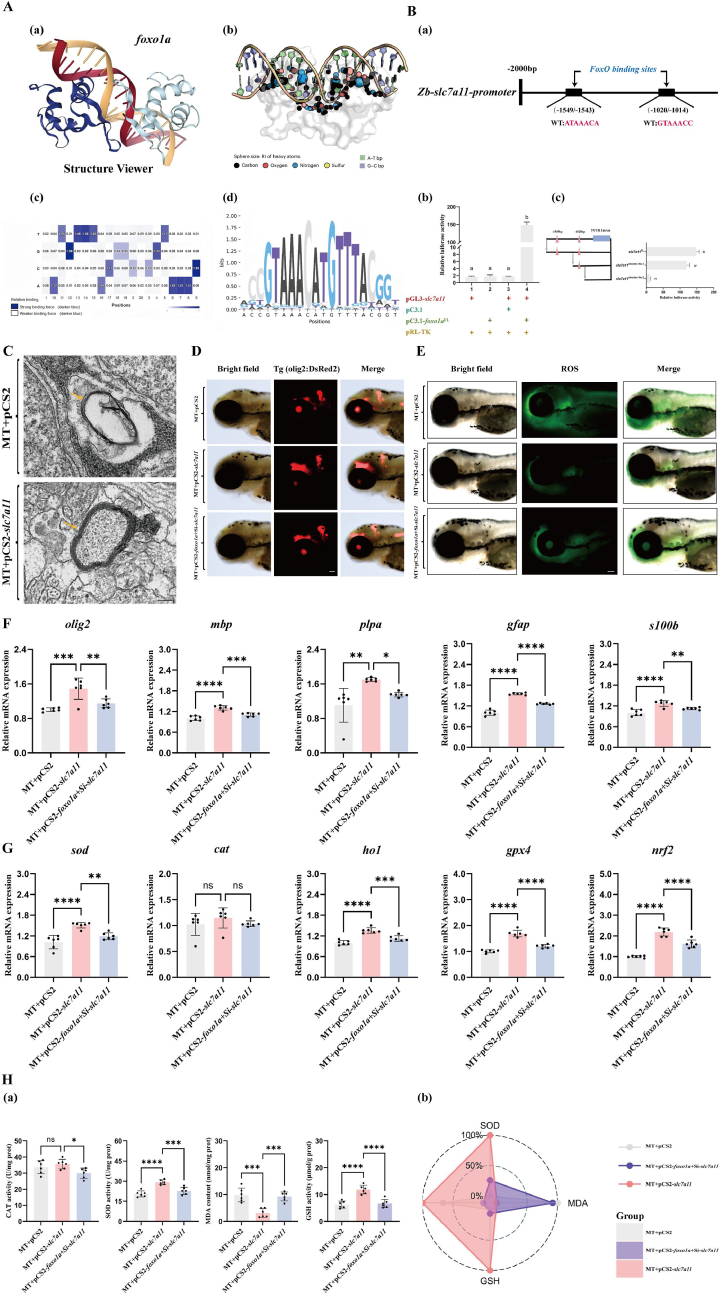
Transcription factor foxo1a regulates the transcription of the slc7a11 gene, protects oligodendrocytes, enhances antioxidant capacity, and reduces ferroptosis.
A: Prediction of transcription factor binding sites. (a) Schematic diagram of the binding of the foxo1a transcription factor to DNA structure. (b) Calculation of the relative importance (RI) score of heavy atoms within a symmetrical helix range of 5A (represented by sphere sizes: maximum 1, minimum 0) (normalized to the maximum value between atoms). (c) DeepPBS output binding specificity score. (d) Base selection intensity at the promoter sites of target genes bound by the foxo1a gene. Purple indicates competitive mutations where the competition is stronger than the WT competitor, while white indicates weaker competitor mutations.
B: (a) Analysis diagram of the specific binding sites of foxo1a on the slc7a11 gene promoter. (b) pGL3 and pC3.1 represent the circular pGL3-basic plasmid and the circular pcDNA3.1 (+) plasmid, respectively. The slc7a11 gene promoter sequence was homologously recombined with the linearized pGL plasmid to construct the reporter plasmid pGL-slc7a11. The full-length CDS sequence of foxo1a was homologously recombined with the linearized pcDNA3.1 (+) plasmid to construct the expression plasmid pC3.1-foxo1a. The Rluc-expressing pRL-TK plasmid was co-transfected in each group to characterize transfection efficiency. The Arabic numerals near the x-axis indicate different treatment groups. Different letters indicate significant differences (P < 0.05). (c) Fragmentation deletion experiment on the transcriptional regulation of the slc7a11 gene by the transcription factor foxo1a. Pink triangles (△) indicate the predicted binding sites of the foxo1a transcription factor by DeepPBS software. Three black horizontal lines represent the length of the promoter sequences in the reporter plasmid. They were obtained by homologous recombination of the fragmented pGL3-basic plasmid with different lengths of promoter sequences from the slc7a11 gene. Different letters indicate significant differences (P < 0.05).
C: Representative transmission electron microscopy images of myelin in mutant zebrafish larvae injected with empty plasmid and in mutants overexpressing slc7a11. MT represents foxo1a mutant zebrafish.Yellow arrows indicate the location of the myelin, scale bar = 100 nm.
D: Injecting null mutant, overexpressing slc7a11 mutant, overexpressing foxo1a mutant zebrafish then knocking down slc7a11 again, Olig2 fluorescent expression, MT represents foxo1a mutant zebrafish, scale bar = 100 μm
E: Injecting empty vector mutants, overexpressing slc7a11 mutants, overexpressing foxo1a mutants in zebrafish followed by knockdown of slc7a11, ROS fluorescence expression, MT represents foxo1a mutant zebrafish, scale bar = 100 μm
F: Injection of empty vector mutant, overexpression of slc7a11 mutant, and overexpression of foxo1a mutant zebrafish followed by knockdown of slc7a11 in larvae brain olig2, mbp, plpa, gfap and s100b oligodendrocyte-related gene expression. MT represents foxo1a mutant zebrafish, N = 6, oneway ANOVA with Tukey's post-hoc test, ∗p < 0.05, ∗∗p < 0.01, ∗∗∗p < 0.001, ∗∗∗∗p < 0.0001
G: Injecting empty vector mutants, overexpressing slc7a11 mutants, overexpressing foxo1a mutants and then knocking down slc7a11 in zebrafish larvae brain tissue, examining the expression of antioxidant-related genes sod, cat, ho1, gpx4 and nrf2. MT represents foxo1a mutant zebrafish, N = 6, oneway ANOVA with Tukey's post-hoc test, ∗p < 0.05, ∗∗p < 0.01, ∗∗∗p < 0.001, ∗∗∗∗p < 0.0001.
H: (a) Injection of empty vector foxo1a mutant, overexpression of slc7a11 mutant, overexpression of foxo1a mutant followed by knockdown of slc7a11 on antioxidant enzyme activity in zebrafish larvae brain tissue: SOD activity, CAT activity, GSH activity and MDA content. MT represents foxo1a mutant zebrafish, N = 6, oneway ANOVA with Tukey's post-hoc test, ∗p < 0.05, ∗∗p < 0.01, ∗∗∗p < 0.001, ∗∗∗∗p < 0.0001. (b) IBR calculated the star plot of antioxidant enzyme activity in the brain tissue of zebrafish larvae injected with empty vector mutants, overexpressing slc7a11 mutants, and overexpressing foxo1a mutants with slc7a11 knockdown. MT represents foxo1a mutant zebrafish.
Acknowledgments
This image is the copyrighted work of the attributed author or publisher, and
ZFIN has permission only to display this image to its users.
Additional permissions should be obtained from the applicable author or publisher of the image.
Full text @ Redox Biol.