Figure Caption
Fig. 3
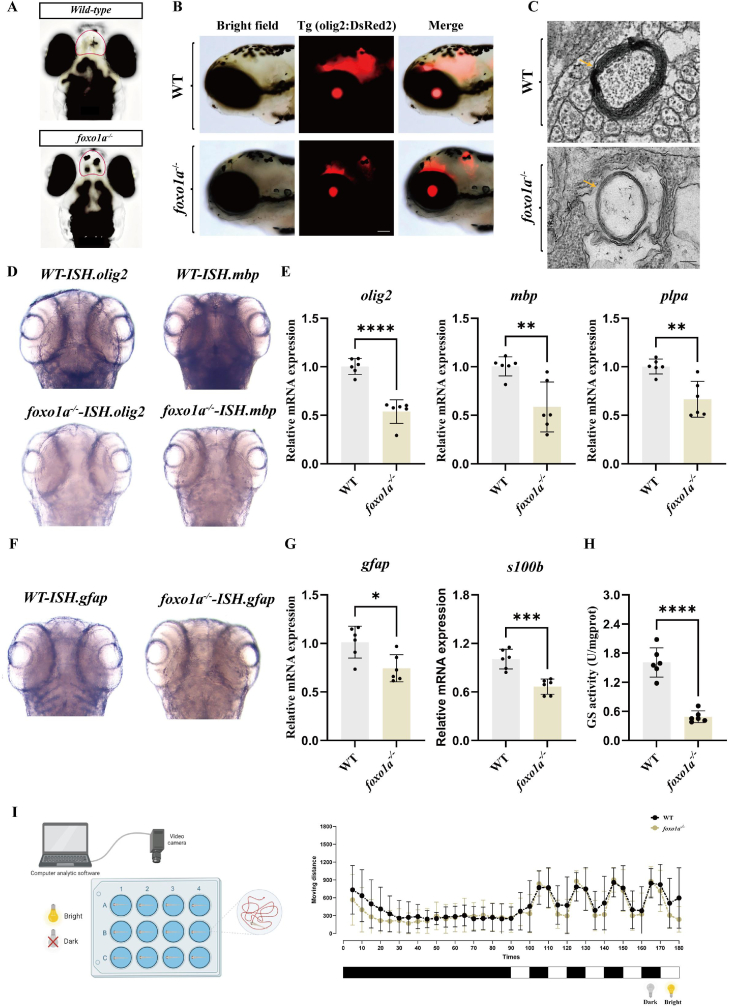
Mutant of the foxo1a gene leads to abnormal development of the telencephalon, oligodendrocytes, and myelin in zebrafish, as well as abnormal development of astrocytes and behavioral abnormalities.
A: Dorsal view of the brains of control and foxo1a−/− larvae, the red coil indicates the position of the telencephalon.
B: Expression of olig2 fluorescent protein in the brains of control and foxo1a−/− groups, with reduced fluorescence in the foxo1a−/− group, scale bar = 100 μm
C: Representative transmission electron micrographs of myelin in control and foxo1a−/− larvae, the yellow arrow indicates the location of the myelin, scale bar = 100 nm
D: In situ hybridization of olig2 and mbp in control and foxo1a−/− groups.
E: qRT-PCR analysis of olig2, mbp, and plpa gene expression in oligodendrocytes of control and foxo1a−/− zebrafish larvae, N = 6, t-test, ∗p < 0.05, ∗∗p < 0.01, ∗∗∗p < 0.001, ∗∗∗∗p < 0.0001
F: In situ hybridization of gfap in control and foxo1a−/− groups.
G: Expression of gfap and s100b genes in astrocytes of control and foxo1a−/− zebrafish larvae.,N = 6, t-test, ∗p < 0.05, ∗∗p < 0.01, ∗∗∗p < 0.001, ∗∗∗∗p < 0.0001
H: Comparison of glutamine synthetase activity in control and foxo1a−/− zebrafish larvae, N = 6, t-test, ∗p < 0.05, ∗∗p < 0.01, ∗∗∗p < 0.001, ∗∗∗∗p < 0.0001
I: Schematic of the light-dark alternation behavior experiment, where the Viewpoint tool observes zebrafish for 90 min under normal daylight, followed by minute-by-minute light-dark alternations, and records the distance moved by control and foxo1a−/− zebrafish larvae every 10 min.
Acknowledgments
This image is the copyrighted work of the attributed author or publisher, and
ZFIN has permission only to display this image to its users.
Additional permissions should be obtained from the applicable author or publisher of the image.
Full text @ Redox Biol.