
|
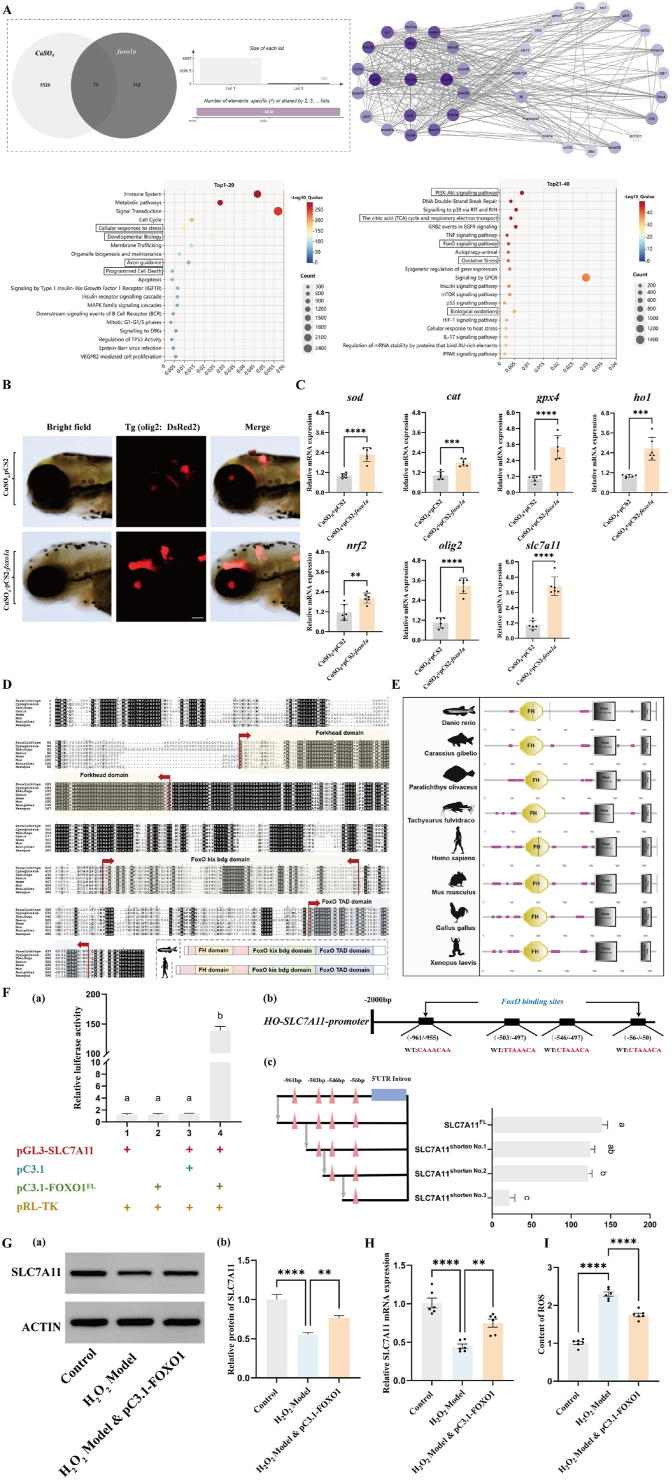
Fig. 7
Application of
A: Network molecular analysis results. (a) Venn diagram showing the number of common targets between
B:
C: mRNA expression levels of
D: Protein sequence alignment of
E: Structural analysis of representative proteins from the
F: (a) pGL3 and pC3.1 represent the circular pGL3-basic plasmid and circular pcDNA3.1 (+) plasmid, respectively. The SLC7A11 gene promoter sequence was homologously recombined with the linearized pGL plasmid to construct the reporter plasmid pGL-SLC7A11. The full-length CDS sequence of FOXO1 was homologously recombined with the linearized pcDNA3.1 (+) plasmid to construct the expression plasmid pC3.1-FOXO1. The pRL-TK plasmid expressing rluc was co-transfected in each group to characterize transfection efficiency. The Arabic numerals near the x-axis indicate different treatment groups. Different letters indicate significant differences (P < 0.05). (b) Analysis diagram of the FOXO1-specific binding site on the SLC7A11 gene promoter. (c) Fragment deletion experiment of the transcriptional regulation of the SLC7A11 gene by transcription factor FOXO1. The pink triangles (△) represent FOXO1 transcription factor binding sites predicted by DeepPBS software. The four black horizontal lines represent the lengths of the promoter sequences in the reporter plasmids. They were obtained by homologous recombination of pGL3 basic plasmid fragments with SLC7A11 gene promoter sequences of different lengths. Different letters indicate significant differences (P < 0.05).
G: (a) In human oligodendrocytes, the expression of SLC7A11 protein in the control group, the H2O2 model group, and the H2O2 model group with overexpressed FOXO1 was evaluated (b) the relative quantification of the SLC7A11 protein was performed using normalization, oneway ANOVA with Tukey's post-hoc test, ∗p < 0.05, ∗∗p < 0.01, ∗∗∗p < 0.001, ∗∗∗∗p < 0.0001.
H: In human oligodendrocytes, the relative expression of SLC7A11 mRNA in the control group, H2O2 model group, and H2O2 model group overexpressing FOXO1, oneway ANOVA with Tukey's post-hoc test, N = 6 ∗ p < 0.05, ∗∗p < 0.01, ∗∗∗p < 0.001, ∗∗∗∗p < 0.0001.
I: In human oligodendrocytes, the ROS levels in the control group, the H2O2 model group, and the H2O2 model group overexpressing FOXO1, oneway ANOVA with Tukey's post-hoc test, N = 6∗ p < 0.05, ∗∗p < 0.01, ∗∗∗p < 0.001, ∗∗∗∗p < 0.0001.