FIGURE SUMMARY
Title

Cancer-associated fibroblast driven paracrine IL-6/STAT3 signaling promotes migration and dissemination in invasive lobular carcinoma

Authors
Bullock, E., Rozyczko, A., Shabbir, S., Tsoupi, I., Young, A.I.J., Travnickova, J., Gómez-Cuadrado, L., Mabruk, Z., Carrasco, G., Morrow, E., Pennel, K., Kloosterman, P., Houthuijzen, J.M., Jonkers, J., Avalle, L., Poli, V., Iggo, R., Xiao, X., Guo, J., Zhu, X., Mallon, E., Edwards, J., Patton, E.E., Brunton, V.G.
Source
Full text @ Breast Cancer Res.

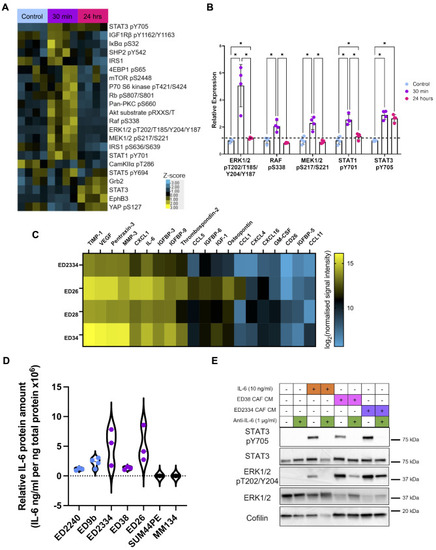
ILC CAF conditioned media drives STAT3 and MAPK pathway activation. (A) Heatmap of significantly changed proteins and phospho-proteins after 30 min–24 h of ED28 CAF conditioned media (CM) stimulation of SUM44PE cells compared to control cells. Protein expression was normalized to fast green stain for total protein and the heatmap shows the z-scores of expression. (B) Proteins with more than 2-fold and significant change in expression in the RPPA, determined by normalizing all values to mean of control. For (A) and (B), significance (* FDR < 0.05) was determined by two-way ANOVA, with multiple comparison correction by two-stage linear step-up procedure of Benjamini, Kreiger and Yeketel (BKY) in GraphPad Prism. (C) Heatmap of the top 20 most highly secreted proteins by primary ILC patient derived CAFs, n = 3 biological replicates for ED2334, ED26 and ED28, n = 2 for ED34. Heatmap shows log2 of signal intensity normalized to CAF cell pellet protein concentration, showing the mean across replicates. (D) Concentration of IL-6 in CM collected after 72 h from primary NST CAFs (blue), ILC CAFs (purple), and the ILC tumor cell lines SUM44PE and MM134 determined by ELISA, normalized to cell pellet protein concentration. (E) Western blot of SUM44PE cells stimulated for 30 min with recombinant human IL-6 (10 ng/mL) or CAF-CM from primary ILC CAFs (ED38 and ED2334) +/- anti-IL-6 blocking antibody (1 µg/mL)

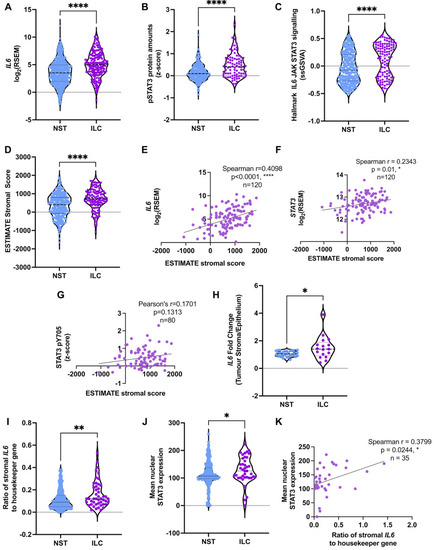
IL-6/STAT3 pathway is augmented in ER + ILC compared to ER + NST tumors. (A, B) Expression of IL6 (A) and pSTAT3 (B) in TCGA RNAseq and RPPA dataset, ER + ILC (n = 191) and ER + NST (n = 555). (C) Enrichment of “Hallmark IL6 JAK STAT3 signaling” in ER + ILC following GSVA of TCGA RNA-Seq dataset. (D) ESTIMATE stromal scores (NST n = 332, ILC n = 120). E-G Spearman correlation of ESTIMATE stromal score with IL6 (E), STAT3 (F) and pSTAT3 (G) expression in ER + ILC tumors (RNAseq data n = 120, RPPA data n = 80). (H) Fold change of IL6 expression in stroma compared to tumor epithelial compartment in laser capture microdissection data for NST (n = 34, GSE68744) and ILC (n = 17, GSE148398). (I) Expression of IL6 in the stromal compartment of ER + NST (n = 412) and ER + ILC (n = 63) determined by RNAscope, p = 0.008. (J) Expression of nuclear STAT3 in the tumor compartment of ER + tumors (NST n = 332, ILC n = 39), p = 0.019. Unpaired two-tailed (A and D) t-test and (B, C, H) Mann-Whitney tests in GraphPad Prism, * p < 0.05, ** p < 0.01, **** p < 0.0001. (I-J) two-tailed Mann-Whitney U tests in SPSS. K Spearman correlation between stromal IL6 and tumoral nuclear STAT3 in ER + ILC tumors (n = 35). All correlation analysis carried out in GraphPad Prism

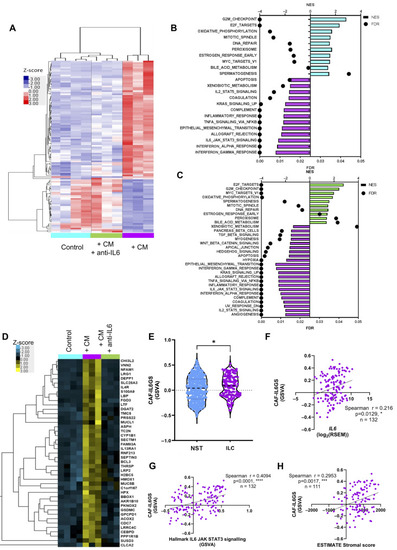
IL-6 in CAF conditioned media drives gene expression in ILC cells. (A) SUM44PE ILC cells were stimulated for 24 h with CAF-CM from ED26 ILC CAFs +/- IL-6 neutralizing antibody (1 µg/mL). Heatmap showing unbiased hierarchical clustering of the 110 differentially expressed genes determined by a generalized linear model likelihood ratio ANOVA-like test, FDR < 0.05. (B) Significantly enriched Hallmark gene sets in control (blue) and conditioned media treated samples (purple), FDR < 0.05 and, (C) CAF-CM stimulated cells (purple bars) were compared to CAF-CM + anti-IL-6 stimulated cells (green bars), FDR < 0.05. (D) Heatmap of the 43 genes in the CAF induced IL-6-dependent gene signature (CAF-IL6GS) from the RNA-Seq dataset. (E) CAF-IL6GS score calculated by ssGSVA in ER + NST (n = 427) and ER + ILC (n = 132) tumors in TCGA, Mann-Whitney test p = 0.0154 using GraphPad Prism. CAF-IL6GS score positively and significantly correlates with, (F) IL6 expression, (G) Hallmark IL6-JAK-STAT3 gene signature (n = 132) and, (H) ESTIMATE stromal score (n = 111) in ER + ILC tumors, Spearman correlation, * p < 0.05, *** p < 0.001, **** p < 0.0001 carried out using GraphPad Prism

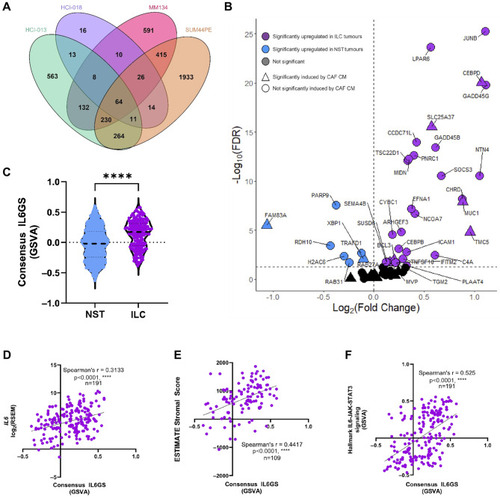
IL-6 drives consistent gene changes in multiple ILC models. (A) Venn diagram of differentially expressed genes in IL-6 treated HCI-013 (green), HCI-018 (purple) ER + ILC PDOs and MM134 (pink) and SUM44PE (orange) ILC cell lines. 64 genes were differentially expressed by IL-6 in all four models. (B) Volcano plot of differential expression of 61 genes in the consensus IL6GS between ER + ILC (n = 191) and ER + NST (n = 563) tumors in the TCGA Firehose dataset. Genes significantly differentially expressed (Wilcoxon U test, FDR < 0.05) and upregulated in ILC (purple) or NST (blue), triangles indicate genes also significantly upregulated by CAF CM in SUM44PE cells. (C) Consensus IL6GS score calculated by GSVA in ER + ILC and ER + NST tumors from TCGA, Mann-Whitney test **** p < 0.0001 in GraphPad Prism. Expression of the Consensus IL6GS score significantly and positively correlates with (D) IL6, (E) ESTIMATE stromal score (n = 109), and (F) Hallmark IL6-JAK-STAT3 signaling gene set (n = 191) in ER + ILC tumors, Spearman correlation in GraphPad Prism

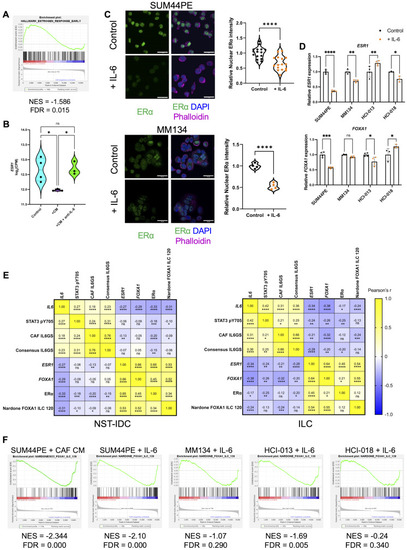
IL-6 regulates estrogen receptor and FOXA1 expression in ILC tumor cells. (A) GSEA plot of the Hallmark Estrogen Response Early gene set comparing control SUM44PE cells to CAF CM stimulated cells. (B) Expression of ESR1 in SUM44PE cells stimulated with CAF CM +/- anti-IL-6. (C) Representative images of (top) SUM44PE and (bottom) MM134 cells cultured for 1 week in complete media +/- 10 ng/ml recombinant human IL-6, showing ERα expression (green), nuclei labelled with DAPI (blue) and actin with phalloidin (magenta). Images at 60X magnification, scale bar showing 25 μm. Quantification of relative nuclear localization (mean gray value normalized to mean of control cells) of ERα in SUM44PE cells (n = 3 biological replicates with 5–6 random fields of view (FoVs) per condition) and MM134 n = 4 random FoVs. Each point represents the mean relative intensity of one FoV normalized to the mean of the control. Unpaired t-test in GraphPad Prism, **** p < 0.0001. (D) Relative expression of (top) ESR1 and (bottom) FOXA1 in SUM44PE, MM134, HCI-013 and HCI-018 + IL-6, showing expression normalized to control cells, each point representing a biological replicate. Two-way ANOVA with Šídák’s multiple comparisons test in GraphPad Prism, adjusted * p < 0.05, ** p < 0.01, *** p < 0.001, **** p < 0.0001. (E) Correlation matrices of IL6, ESR1, FOXA1 (RNAseq), STAT3 pY705, ER⍺ (RPPA), Nardone FOXA1 signature and CAF and consensus IL6GS (ssGSVA scores) in (left) ER + NST and (right) ER + ILC in the TCGA dataset. NST, RNAseq and ssGSVA scores n = 555, RPPA n = 420, ILC RNAseq and ssGSVA n = 191, RPPA n = 143. Values shown are Pearson’s r carried out in GraphPad Prism, not significant ns, * p < 0.05, ** p < 0.01, *** p < 0.001, **** p < 0.0001. (F) GSEA plots of enrichment of the ILC-specific 120-gene FOXA1 signature described by Nardone et al. (A) and (F), NES < 0 enriched in control cells, FDR < 0.05 considered significant

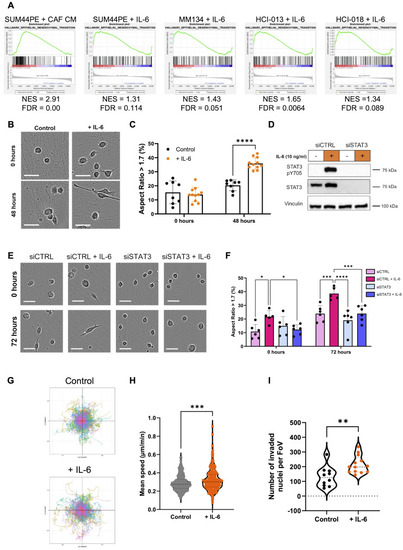
IL-6 drives a mesenchymal and pro-migratory phenotype in SUM44PE cells. (A) Enrichment of Hallmark EMT gene set in (left to right) CAF CM (NES > 0) treated SUM44PE cells compared to both control and CM + anti-IL6 cells, IL-6 treated SUM44PE, MM134, HCI-013 and HCI-018 compared to control. NES > 0, enriched in CAF CM or IL-6 treated cells, FDR < 0.05 considered significant. (B) Representative images of SUM44PE cells adhered to ILC CAF CDMs at time of stimulation (top, 0 h) and 48 h (bottom) after stimulation with IL-6 (10 ng/ml). (C) Quantification of the percentage of cells with AR > 1.7, indicating a mesenchymal phenotype. (D) Western blot of SUM44PE cells treated with siCTRL or siSTAT3 for 48 h then stimulated +/- IL-6 for 24 h. (E) Representative images of SUM44PE cells treated with siCTRL or siSTAT3 and seeded onto ILC CAF CDMs. Images at time of stimulation (top, 0 h) and (bottom) 72 h after IL-6 stimulation. (F) Quantification of percentage of cells with AR > 1.7. (B) and (E) – Images taken at 10x on Incucyte S3, scale bar shows 50 μm, (C) and (F) – n = 3 biological replicates with two FoVs per replicate, two-way ANOVA with (C) Sidak’s and (E) Tukey’s multiple comparison tests in GraphPad Prism * adjusted p < 0.05, ** adjusted p < 0.01, *** adjusted p < 0.001, **** adjusted p < 0.0001. (G) Representative co-ordinate plots of SUM44PE migration over 72 h +/- IL-6. (H) Speed of individual SUM44PE cells over 72 h in complete media +/- IL-6 (10 ng/ml), images taken every 30 min, n = 3 biological replicates, unpaired t-test p < 0.001. Analyzed using Trackmate plugin in ImageJ. (I) Quantification of number of SUM44PE cells that have undergone haptotaxis towards collagen. Number of nuclei, control n = 3 biological replicates, + IL-6 n = 4 biological replicates with 3 or 4 FoVs imaged per repeat, each point represents one FoV, Mann-Whitney test ** p < 0.01 in GraphPad Prism

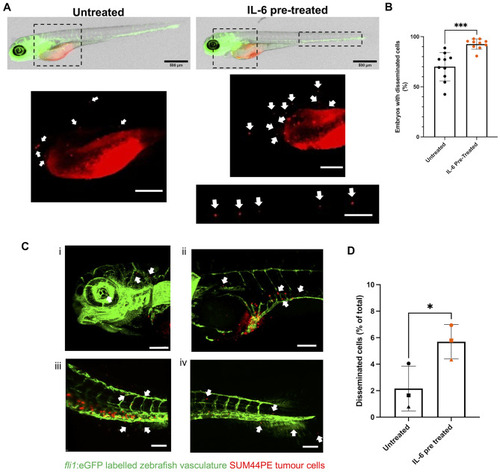
IL-6 promotes increased dissemination of SUM44PE cells in zebrafish embryos. (A) Representative images of 2dpi/4dpf Casper Tg(fli1:eGFP) Zebrafish embryos injected with untreated (left) or IL-6 pre-treated (right) SUM44PE cells, images on mesoscope at 3.2x, scale bar shows 500 μm with disseminated cells indicated by arrows. Dashed boxes represent zoomed in regions shown below, scale bars show 200 μm. (B) Quantification of the percentage of embryos with or without disseminated cells, n = 9 independent biological replicates. (C) Representative 3D projections of fixed 2dpi/4dpf embryos showing disseminated cells in the (i) head and heart, (ii) the SIV, (iii) CHT and (iv) the tail fin. Arrows indicate cells that have extravasated from the vasculature, z-stacks with 3 μm steps on Andor Dragonfly confocal microscope, scale bars show 100 μm. (D) Quantification of the percentage of all SUM44PE cells that are disseminated in the embryos (outside the primary site and extravasated from the vasculature). Quantified using Imaris 10.0.1. n = 3 biological replicates, with 3–4 embryos in each group per replicate, points represent the mean of each replicate. (C) and (E) two-way paired t-tests in GraphPad Prism, * p < 0.05, *** p < 0.001. fli1:eGFP labelled vasculature in green, DiI-dyed SUM44PE cells in red

Acknowledgments
This image is the copyrighted work of the attributed author or publisher, and ZFIN has permission only to display this image to its users. Additional permissions should be obtained from the applicable author or publisher of the image. Full text @ Breast Cancer Res.