IMAGE

Fig. 3

ID
ZDB-IMAGE-250703-4
Source
Figures for Bullock et al., 2025
Image
Figure Caption

Fig. 3

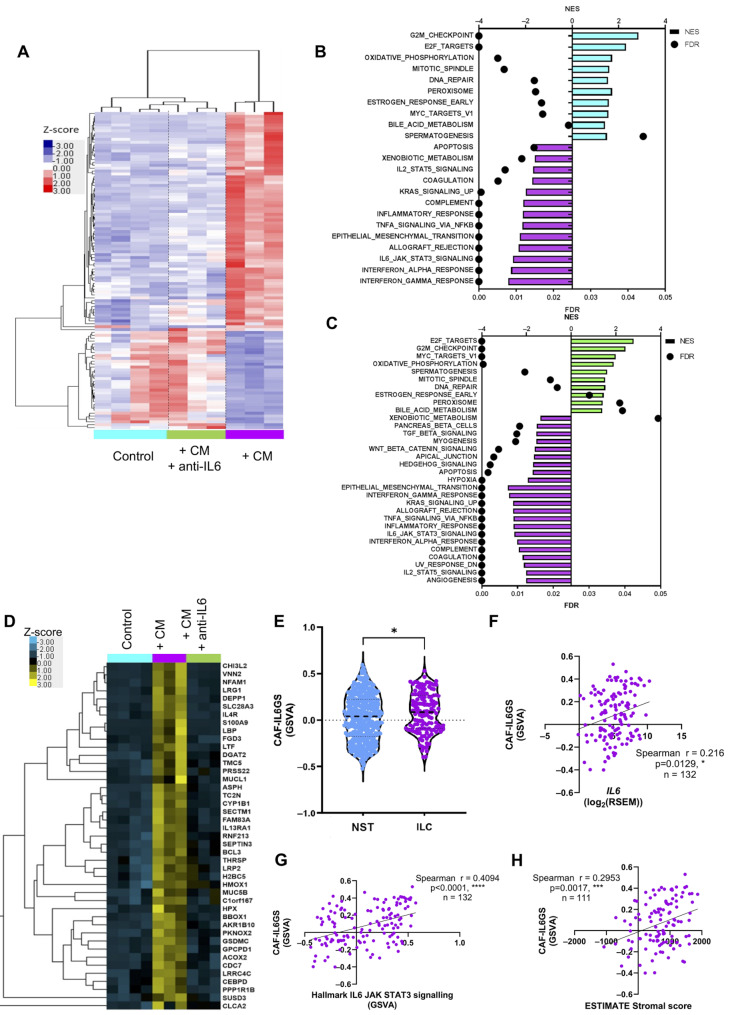
IL-6 in CAF conditioned media drives gene expression in ILC cells. (A) SUM44PE ILC cells were stimulated for 24 h with CAF-CM from ED26 ILC CAFs +/- IL-6 neutralizing antibody (1 µg/mL). Heatmap showing unbiased hierarchical clustering of the 110 differentially expressed genes determined by a generalized linear model likelihood ratio ANOVA-like test, FDR < 0.05. (B) Significantly enriched Hallmark gene sets in control (blue) and conditioned media treated samples (purple), FDR < 0.05 and, (C) CAF-CM stimulated cells (purple bars) were compared to CAF-CM + anti-IL-6 stimulated cells (green bars), FDR < 0.05. (D) Heatmap of the 43 genes in the CAF induced IL-6-dependent gene signature (CAF-IL6GS) from the RNA-Seq dataset. (E) CAF-IL6GS score calculated by ssGSVA in ER + NST (n = 427) and ER + ILC (n = 132) tumors in TCGA, Mann-Whitney test p = 0.0154 using GraphPad Prism. CAF-IL6GS score positively and significantly correlates with, (F) IL6 expression, (G) Hallmark IL6-JAK-STAT3 gene signature (n = 132) and, (H) ESTIMATE stromal score (n = 111) in ER + ILC tumors, Spearman correlation, * p < 0.05, *** p < 0.001, **** p < 0.0001 carried out using GraphPad Prism

Acknowledgments
This image is the copyrighted work of the attributed author or publisher, and ZFIN has permission only to display this image to its users. Additional permissions should be obtained from the applicable author or publisher of the image. Full text @ Breast Cancer Res.