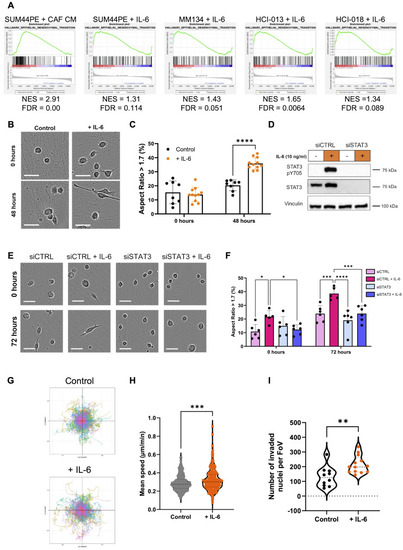
IL-6 drives a mesenchymal and pro-migratory phenotype in SUM44PE cells. (A) Enrichment of Hallmark EMT gene set in (left to right) CAF CM (NES > 0) treated SUM44PE cells compared to both control and CM + anti-IL6 cells, IL-6 treated SUM44PE, MM134, HCI-013 and HCI-018 compared to control. NES > 0, enriched in CAF CM or IL-6 treated cells, FDR < 0.05 considered significant. (B) Representative images of SUM44PE cells adhered to ILC CAF CDMs at time of stimulation (top, 0 h) and 48 h (bottom) after stimulation with IL-6 (10 ng/ml). (C) Quantification of the percentage of cells with AR > 1.7, indicating a mesenchymal phenotype. (D) Western blot of SUM44PE cells treated with siCTRL or siSTAT3 for 48 h then stimulated +/- IL-6 for 24 h. (E) Representative images of SUM44PE cells treated with siCTRL or siSTAT3 and seeded onto ILC CAF CDMs. Images at time of stimulation (top, 0 h) and (bottom) 72 h after IL-6 stimulation. (F) Quantification of percentage of cells with AR > 1.7. (B) and (E) – Images taken at 10x on Incucyte S3, scale bar shows 50 μm, (C) and (F) – n = 3 biological replicates with two FoVs per replicate, two-way ANOVA with (C) Sidak’s and (E) Tukey’s multiple comparison tests in GraphPad Prism * adjusted p < 0.05, ** adjusted p < 0.01, *** adjusted p < 0.001, **** adjusted p < 0.0001. (G) Representative co-ordinate plots of SUM44PE migration over 72 h +/- IL-6. (H) Speed of individual SUM44PE cells over 72 h in complete media +/- IL-6 (10 ng/ml), images taken every 30 min, n = 3 biological replicates, unpaired t-test p < 0.001. Analyzed using Trackmate plugin in ImageJ. (I) Quantification of number of SUM44PE cells that have undergone haptotaxis towards collagen. Number of nuclei, control n = 3 biological replicates, + IL-6 n = 4 biological replicates with 3 or 4 FoVs imaged per repeat, each point represents one FoV, Mann-Whitney test ** p < 0.01 in GraphPad Prism
|
