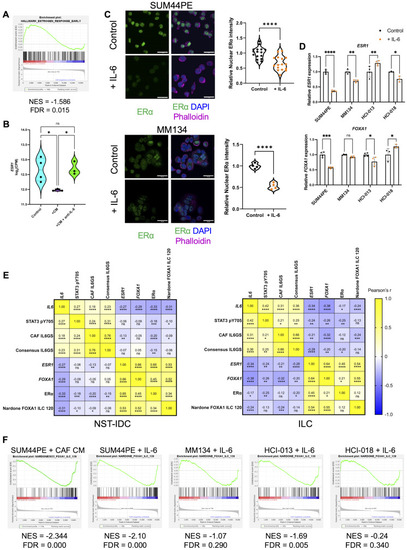
IL-6 regulates estrogen receptor and FOXA1 expression in ILC tumor cells. (A) GSEA plot of the Hallmark Estrogen Response Early gene set comparing control SUM44PE cells to CAF CM stimulated cells. (B) Expression of ESR1 in SUM44PE cells stimulated with CAF CM +/- anti-IL-6. (C) Representative images of (top) SUM44PE and (bottom) MM134 cells cultured for 1 week in complete media +/- 10 ng/ml recombinant human IL-6, showing ERα expression (green), nuclei labelled with DAPI (blue) and actin with phalloidin (magenta). Images at 60X magnification, scale bar showing 25 μm. Quantification of relative nuclear localization (mean gray value normalized to mean of control cells) of ERα in SUM44PE cells (n = 3 biological replicates with 5–6 random fields of view (FoVs) per condition) and MM134 n = 4 random FoVs. Each point represents the mean relative intensity of one FoV normalized to the mean of the control. Unpaired t-test in GraphPad Prism, **** p < 0.0001. (D) Relative expression of (top) ESR1 and (bottom) FOXA1 in SUM44PE, MM134, HCI-013 and HCI-018 + IL-6, showing expression normalized to control cells, each point representing a biological replicate. Two-way ANOVA with Šídák’s multiple comparisons test in GraphPad Prism, adjusted * p < 0.05, ** p < 0.01, *** p < 0.001, **** p < 0.0001. (E) Correlation matrices of IL6, ESR1, FOXA1 (RNAseq), STAT3 pY705, ER⍺ (RPPA), Nardone FOXA1 signature and CAF and consensus IL6GS (ssGSVA scores) in (left) ER + NST and (right) ER + ILC in the TCGA dataset. NST, RNAseq and ssGSVA scores n = 555, RPPA n = 420, ILC RNAseq and ssGSVA n = 191, RPPA n = 143. Values shown are Pearson’s r carried out in GraphPad Prism, not significant ns, * p < 0.05, ** p < 0.01, *** p < 0.001, **** p < 0.0001. (F) GSEA plots of enrichment of the ILC-specific 120-gene FOXA1 signature described by Nardone et al. (A) and (F), NES < 0 enriched in control cells, FDR < 0.05 considered significant
|
