
- Title
-
Binocular integration of prey stimuli in the zebrafish visual system
- Authors
- Tian, G., Lam, T.K.C., Yan, G., He, Y., Khan, B., Qu, J.Y., Semmelhack, J.L.
- Source
- Full text @ Curr. Biol.
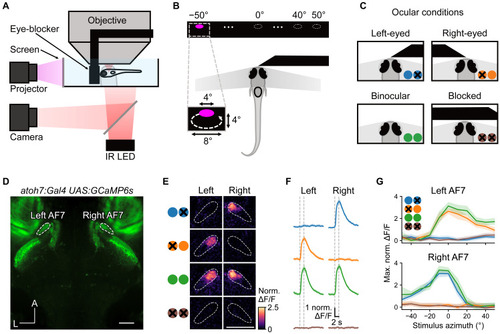
Reversible occlusion of one eye blocks the response to prey stimuli (A) Schematic of the experimental setup: the eye-blocker is positioned in front of the fish to block visual input. (B) Bright UV circulating prey-like stimuli were presented at azimuths from −50° (left) to +50° (right). (C) Larvae were tested under 4 ocular conditions: right eye blocked, left eye blocked, neither eye blocked, and both eyes blocked. (D) Baseline fluorescence image showing AF7s labeled with GCaMP6s (scale bar, 50 μm). (E) Activation of AF7 in left eye, right eye, binocular, and fully blocked conditions in one example larva (scale bar, 50 μm). Pixels are color-coded by trial-averaged increase in mean ΔF/F during the stimulus interval, compared with that during the 2 s before the stimulus. (F) Response of the left and right AF7 to 0° prey stimulus. Vertical dashed lines indicate the stimulus interval. Solid line and shaded region represent the mean and 95% confidence interval, respectively (n = 7 fish). (G) Spatial tuning curves showing maximum activity of AF7 (within the 3-s time window after stimulus onset) in response to prey stimuli at different azimuths. Solid lines and shaded regions represent the mean and 95% confidence interval, respectively (n = 7 fish). See also Figure S1. |
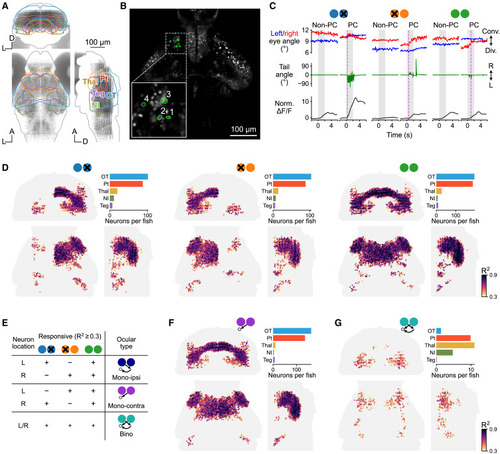
Volumetric two-photon imaging in different ocular conditions identifies bino-PRNs (A) Map of the imaging volume. Each gray dot represents one neuron. Coronal, horizontal, and sagittal views (all anatomical maps follow the same layout unless otherwise stated). (B) Maximum activity (within the 3-s time window after stimulus onset) of each neuron in response to stimuli at different azimuths in the three ocular conditions. Solid lines and shaded regions represent mean and ±1 SD, respectively (n = 8 trials). (C) Eye and tail movements triggered by prey stimuli and normalized ΔF/F responses of example neuron no. 1. Magenta dashed lines indicate hunting onsets (defined by eye convergence). (D) Maps of PRNs in different ocular conditions from coronal, horizontal, and sagittal views (n = 15 fish). Neurons with prey-related activity were identified with regression analysis for each ocular condition, using an R2 threshold of 0.3. Color code represents R2 value. Bar plots show average number of neurons in selected brain regions. (E) Schematic of the assignment of ocular type, based on responsiveness in different ocular conditions. (F and G) Maps of the anatomical locations of monocular contra-PRNs (mono-contra) and bino-PRNs. See also Figures S2–S4 and Video S1. |
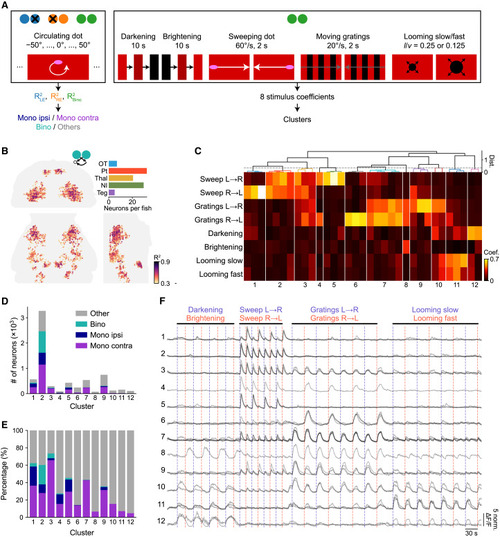
Bino-PRNs respond specifically to prey stimuli (A) Schematic of the stimulus protocol. Circulating UV prey-like stimuli were presented on a red background in different ocular conditions, and a battery of eight other types of stimuli were presented binocularly to assess the specificity of bino-PRNs. (B) Bino-PRNs were found in the Pt, Thal, and NI, using the same method as in Figure 2. (C) Hierarchical clustering revealed 12 clusters that responded primarily to prey, moving gratings, or looming stimuli. (D and E) Number and percentage of neurons in each cluster that are bino- or mono-PRNs. (F) Calcium traces of all exemplars (gray) from each cluster. Blue and red vertical lines represent repeats of the two different stimuli within each stimulus category. Different shades of gray represent the activity of different subclusters within each cluster shown in (C) (n = 10 fish). |

Bino-PRNs receive input from the two eyes that are offset in horizontal space and correspond to objects at different distances from a hunting larva (A) Monocular and binocular tuning curves of three example bino-PRNs from one larva. Blue line represents the left eye response to stimuli presented at each azimuth, orange line represents the right eye response, and green is the binocular condition. Shading represents 1 SD. (B) Distribution of the distances between the peaks of the left eye and right eye receptive fields for all bino-PRNs. Degree values indicate distance between the best left-eye (LE) and right-eye (RE) stimulus in screen coordinates. (C) Schematic showing how left eye/right eye peak separations in the imaging preparation correspond to object distances at medium (60°) and maximum (75°) levels of convergence. Blue lines = 10° separation, purple lines = 30° separation, violet lines = 50° separation between right and left eye peaks. See also Figure S4. |

Bino-PRNs are motor modulated and receive binocular input in no behavior trials (A) Anatomical locations of bino-PRNs in four selected regions of the brain; coronal, horizontal, and sagittal views. (B) Average responses of bino-PRNs in each region and mono-contra neurons in the OT to PC and non-PC trials (defined by eye convergence) to prey at 0° in different ocular conditions. In the ipsi condition, only the ipsilateral eye relative to the PRN was able to see the stimulus. Solid lines and shaded regions represent mean and ±1 SD, respectively. (C) Percent of bino- and contra-PRNs with significantly larger responses during hunting trials. Trial response is calculated as the mean dF/F between +1 and +3 s after stimulus onset. A neuron’s response is considered significantly greater if the one-sided Mann-Whitney U test, comparing hunting trial responses to NR trial responses, results in a p value less than 0.05. (D) Proportion of bino- and contra-PRNs with significantly greater responses in hunting trials in each brain area. See also Figure S5. |

Identification of a transgenic line labeling bino-PRNs (A) Expression pattern of the KalTAu508 line. (B–D) Binocular, mono-ipsi, and mono-contra PRNs in the u508 line (n = 7 fish). (E) Expression pattern of the lhx9 line. (F–H) Binocular, mono-ipsi, and mono-contra PRNs in the lhx9 line (n = 5 fish). (I) Average response of the mono-contra PRNs in the KalTA4u508 line in PC and non-PC trials. Solid lines and shaded regions represent mean and ±1 SD, respectively. (J) Average response of the bino-PRNs in the lhx9 line. Solid lines and shaded regions represent mean and ±1 SD, respectively. |
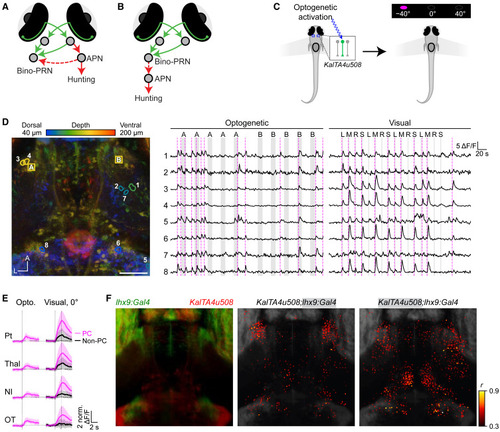
Optogenetically triggered hunting events activate PRNs (A) Our hypothesis for interactions between command-like APN neurons and bino-PRNs. (B) The alternative hypothesis, in which bino-PRNs activate the APN to cause hunting. (C) Schematic of sequential optogenetic activation and visual stimulation paradigm. KalTA4u508+ Pt neurons were holographically activated to trigger PC while performing two-photon calcium imaging. After the opto-imaging session, prey stimuli were presented to record visual responses. (D) Left: example larva expressing GCaMP6s and ChR2 under control of the KalTA4u508 and lhx9 lines. Locations of the stimulation volumes (cyan squares, 12 × 12 μm) and opto-hunting correlated neurons (circles). Middle: calcium traces of the top five opto-hunting correlated neurons in one fish. Gray shading represents stimulation of the right (A) or left (B) APN. Magenta dashed lines represent hunting onsets. Right: responses to visual prey stimuli in the same five neurons to right, middle, and left circulating prey and sweep prey stimuli (RMLS). (E) Responses of opto-hunting neurons in four regions to opto-hunting events and to visual stimulation. (F) Left: the lhx9 (green) and u508 (red) masks. Middle: opto-hunting neurons within the lhx9 mask. Right: opto-hunting neurons in the u508 mask. Dorsal view. n = 5 fish. Scale bar, 50 μm. See also Figures S6 and S7. |