
Image
|
Figure Caption
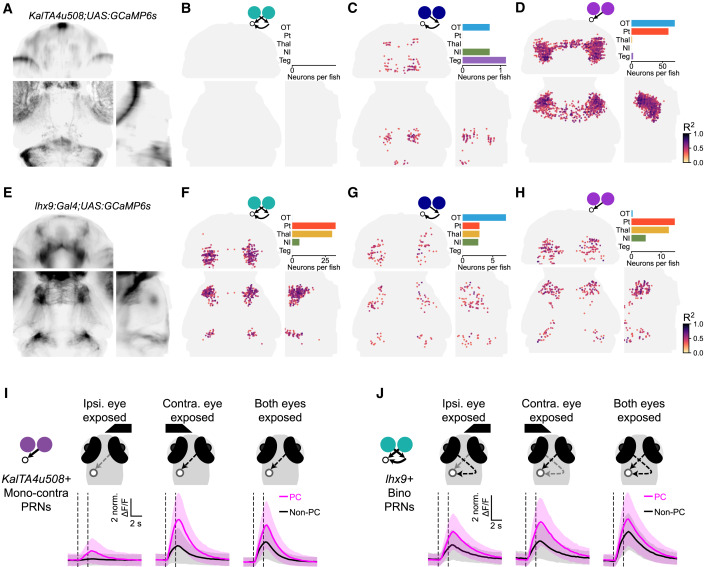
Fig. 6 Identification of a transgenic line labeling bino-PRNs (A) Expression pattern of the KalTAu508 line. (B–D) Binocular, mono-ipsi, and mono-contra PRNs in the u508 line (n = 7 fish). (E) Expression pattern of the lhx9 line. (F–H) Binocular, mono-ipsi, and mono-contra PRNs in the lhx9 line (n = 5 fish). (I) Average response of the mono-contra PRNs in the KalTA4u508 line in PC and non-PC trials. Solid lines and shaded regions represent mean and ±1 SD, respectively. (J) Average response of the bino-PRNs in the lhx9 line. Solid lines and shaded regions represent mean and ±1 SD, respectively.
Acknowledgments
This image is the copyrighted work of the attributed author or publisher, and
ZFIN has permission only to display this image to its users.
Additional permissions should be obtained from the applicable author or publisher of the image.
Full text @ Curr. Biol.