
Fig. 7
- ID
- ZDB-FIG-250804-37
- Publication
- Tian et al., 2025 - Binocular integration of prey stimuli in the zebrafish visual system
- Other Figures
- All Figure Page
- Back to All Figure Page
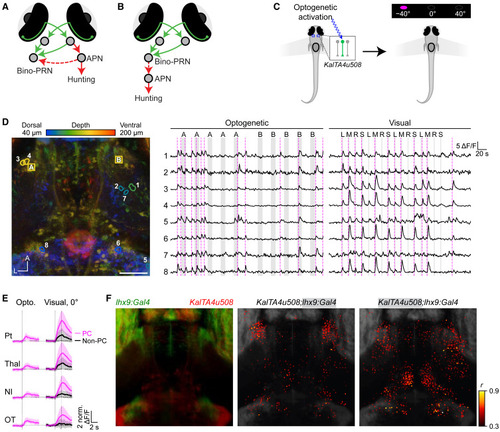
Optogenetically triggered hunting events activate PRNs (A) Our hypothesis for interactions between command-like APN neurons and bino-PRNs. (B) The alternative hypothesis, in which bino-PRNs activate the APN to cause hunting. (C) Schematic of sequential optogenetic activation and visual stimulation paradigm. KalTA4u508+ Pt neurons were holographically activated to trigger PC while performing two-photon calcium imaging. After the opto-imaging session, prey stimuli were presented to record visual responses. (D) Left: example larva expressing GCaMP6s and ChR2 under control of the KalTA4u508 and lhx9 lines. Locations of the stimulation volumes (cyan squares, 12 × 12 μm) and opto-hunting correlated neurons (circles). Middle: calcium traces of the top five opto-hunting correlated neurons in one fish. Gray shading represents stimulation of the right (A) or left (B) APN. Magenta dashed lines represent hunting onsets. Right: responses to visual prey stimuli in the same five neurons to right, middle, and left circulating prey and sweep prey stimuli (RMLS). (E) Responses of opto-hunting neurons in four regions to opto-hunting events and to visual stimulation. (F) Left: the lhx9 (green) and u508 (red) masks. Middle: opto-hunting neurons within the lhx9 mask. Right: opto-hunting neurons in the u508 mask. Dorsal view. n = 5 fish. Scale bar, 50 μm. See also Figures S6 and S7. |