
Fig. 2
- ID
- ZDB-FIG-250804-32
- Publication
- Tian et al., 2025 - Binocular integration of prey stimuli in the zebrafish visual system
- Other Figures
- All Figure Page
- Back to All Figure Page
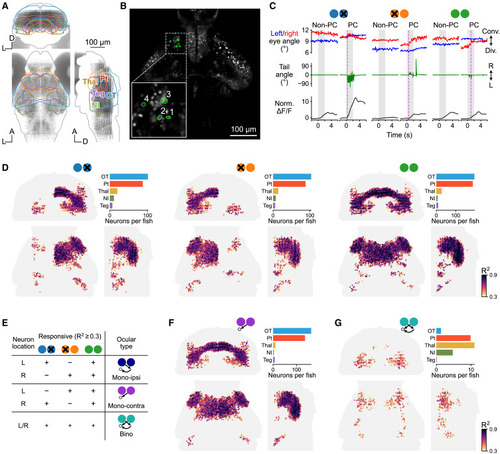
Volumetric two-photon imaging in different ocular conditions identifies bino-PRNs (A) Map of the imaging volume. Each gray dot represents one neuron. Coronal, horizontal, and sagittal views (all anatomical maps follow the same layout unless otherwise stated). (B) Maximum activity (within the 3-s time window after stimulus onset) of each neuron in response to stimuli at different azimuths in the three ocular conditions. Solid lines and shaded regions represent mean and ±1 SD, respectively (n = 8 trials). (C) Eye and tail movements triggered by prey stimuli and normalized ΔF/F responses of example neuron no. 1. Magenta dashed lines indicate hunting onsets (defined by eye convergence). (D) Maps of PRNs in different ocular conditions from coronal, horizontal, and sagittal views (n = 15 fish). Neurons with prey-related activity were identified with regression analysis for each ocular condition, using an R2 threshold of 0.3. Color code represents R2 value. Bar plots show average number of neurons in selected brain regions. (E) Schematic of the assignment of ocular type, based on responsiveness in different ocular conditions. (F and G) Maps of the anatomical locations of monocular contra-PRNs (mono-contra) and bino-PRNs. See also Figures S2–S4 and Video S1. |