FIGURE SUMMARY
Title

Impact of HOMER2 frameshift extension variant on auditory function and development

Authors
Han, E., Kim, J.A., Park, S., Han, J.H., Kim, M.Y., Kim, Y., Tran, N.T., Kim, B.J., Choi, J., Choi, B.Y.
Source
Full text @ J. Mol. Med.

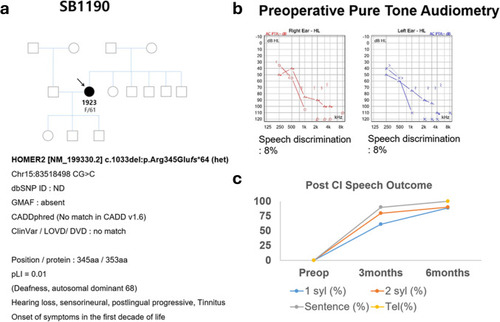
Pedigree, audiometric profile, genetic analysis, and post-cochlear implantation speech outcomes from SB1190-1923 (F/61). a Pedigree of SB1190: the proband (F/61) carries the previously unreported, novel HOMER2 variant (c.1033 del (p.Arg345Glufs*64)) which is associated with DFNA68. Low pLI score (0.01) of HOMER2 suggests that alteration of HOMER2 exerts a pathogenic effect via a mechanism other than loss-of-function. Both parents of SB1190-1923 passed away in their early 70 s without showing any signs of significant hearing loss, and none of the SB1190-1923’s children exhibited any symptoms of hearing loss. b Preoperative pure tone audiograms show profound down-sloping sensorineural hearing loss with 8% speech discrimination score bilaterally. c Post-Cochlear Implantation speech outcome speech recognition improves significantly at 3- and 6-months post-implantation across various syllable and sentence conditions. F, female; pLI, intolerant; CI, cochlear implantation

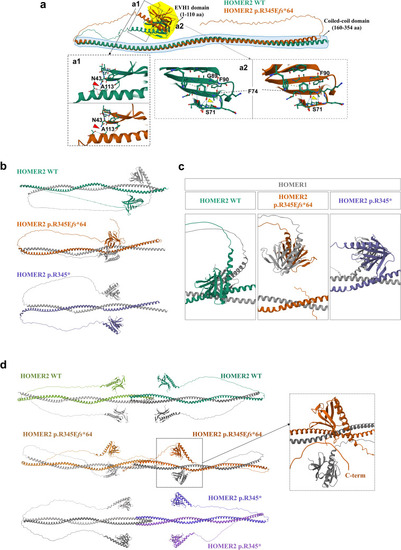
Predicted 3D structures of HOMER2 WT and HOMER2 p.R345Efs*64 using AlphaFold2. a Structural alignment of HOMER2 WT and HOMER2 p.R345Efs*64. The EVH1 domain is highlighted in the yellow area, and the coiled-coil (CC) domain is marked by the blue dashed line. a1 The hydrogen bond between N43 and A113 is disrupted in HOMER2 p.R345Efs*64 compared to HOMER2 WT. a2 The β-sheet structure in HOMER2 p.R345Efs*64 extends to F90, and a hydrogen bond forms between F74 and S71, which is absent in HOMER2 WT. b The structure of the HOMER1 [NP_004263.1] and HOMER2 dimer is shown. HOMER1 is depicted in gray, while HOMER2 WT, HOMER2 p.R345Efs*64, and HOMER2 p.R345* are represented in green, brown, and purple, respectively. The coiled-coil region of HOMER2, which can interact with other proteins, is located at amino acids 307–329 in the WT and is shifted to amino acids 275–297 in the HOMER2 variants. c Structural changes in the EVH1 domain were detected in the HOMER1 WT and HOMER2 variants dimer. The distance between each EVH1 domain of HOMER1 and HOMER2 p.R345Efs*64 was reduced (b) compared to the WT, which is shifted vertically. In HOMER1 WT and HOMER2 p.R345* dimer, the distance between each EVH1 was increased (b) and slightly shifted vertically. d The predicted tetramer structures were obtained using HOMER1 and HOMER2. Two HOMER1 proteins were combined with two HOMER2 WT, two HOMER2 p.R345Efs*64, or two HOMER2 p.R345* molecules. In the HOMER1 and HOMER2 p.R345Efs*64 tetramer, the location of the EVH1 domain of HOMER1 was altered, and the C-terminal of HOMER2 approached the EVH1 domain of HOMER2 (dashed black box). In the HOMER1 and HOMER2 p.R345* tetramer, HOMER1 and HOMER2 formed homodimers, and each homodimer formed a tetramer, unlike the other configurations. WT, wild-type; R, arginine; E, glutamate; fs, frameshift; EVH1, Ena/Vasp homology domain 1; F, phenylalanine; S, serine; N, asparagine; A, alanine

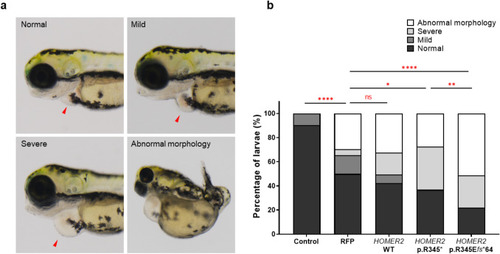
Cardiac and morphological defects in zebrafish larvae injected with HOMER2 mRNA. a Representative images of zebrafish larvae at 3 dpf displaying varying degrees of heart malformations. The larvae were categorized into four groups: normal, mild, and severe heart defects based on the degree of cardiac enlargement, and an additional group with general abnormal morphology. The categories include normal, mild, and severe heart defects, with red arrowheads marking the regions of cardiac deformity. Additionally, larvae with abnormal overall morphology are shown. b Bar graph illustrating the distribution of larvae with heart and morphological abnormalities in the different experimental groups: uninjected control, RFP control, HOMER2 WT, HOMER2 p.R345*, and HOMER2 p.R345Efs*64. Chi-squared analysis was used to compare the proportions of defects between groups, with significant differences indicated. (****p < 0.0001, ***p < 0.001, **p < 0.01, *p < 0.05). n = 100 per group. dpf, days post-fertilization; RFP, red fluorescent protein; WT, wild-type; R, arginine; E, glutamate; fs, frameshift

Otic capsule area in zebrafish larvae at 3 days post-fertilization. a Representative image of 3 dpf zebrafish larvae, with the otic capsule indicated by a red dashed circle. b Bar graph showing the measured otic capsule area in control, RFP control, HOMER2 WT, HOMER2 p.R345*, and HOMER2 p.R345Efs*64 groups. No statistically significant differences were observed between groups (p > 0.05). n = 15 per group. dpf, days post-fertilization; RFP, red fluorescent protein; WT, wild-type; R, arginine; E, glutamate; fs, frameshift

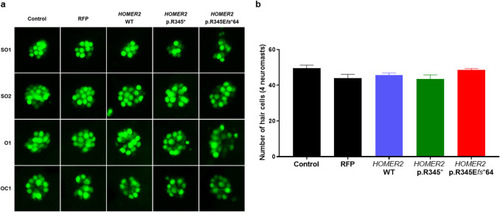
Analysis of hair cell numbers in zebrafish neuromasts. a Representative image of the four neuromasts (SO1, SO2, O1, and OC1) from each group: control, RFP control, HOMER2 WT, HOMER2 p.R345*, and HOMER2 p.R345Efs*64. b Bar graph comparing each group's average number of hair cells across the four neuromasts. No statistically significant differences were observed between the groups (p > 0.05). n = 10 per group. SO1, supraorbital1; SO2, supraorbital2; O1, otic; OC1, occipital; RFP, red fluorescent protein; WT, wild-type; R, arginine; E, glutamate; fs, frameshift

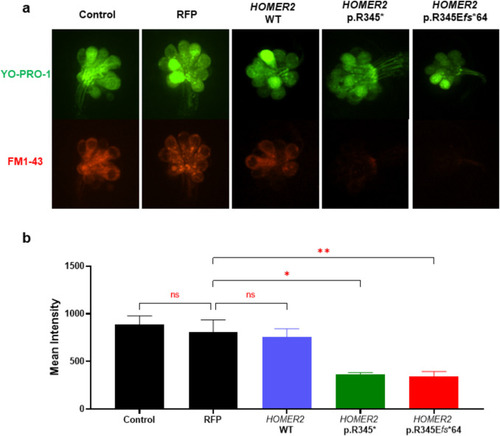
Comparison of FM1-43 uptake in zebrafish neuromast hair cells. a Representative image of neuromast hair cells in control, RFP control, HOMER2 WT, and HOMER2 variant groups. Hair cells are labeled with GFP, and FM1-43 uptake is indicated by mCherry fluorescence. b Bar graph comparing the fluorescence intensity of FM1-43 uptake across groups. While no significant differences were observed between the control, RFP, and HOMER2 WT groups, the HOMER2 variant groups showed a statistically significant reduction in intensity compared to the RFP group (*p < 0.05, **p < 0.01). n = 5 per group. RFP, red fluorescent protein; WT, wild-type

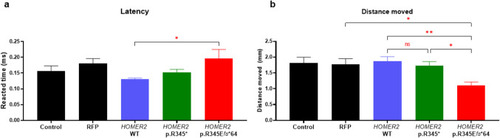
Comparison of startle reflex in zebrafish larvae at 6 days post-fertilization. a Bar graph depicting the latency (time from stimulus application to the onset of movement) across the control, RFP control, HOMER2 WT, HOMER2 p.R345*, and HOMER2 p.R345Efs*64 groups. The latency was significantly longer in the HOMER2 p.R345Efs*64 group compared to HOMER2 WT (p < 0.05). b Bar graph showing the distance moved during the startle response. The HOMER2 p.R345Efs*64 groups exhibited a significant reduction in distance moved compared to HOMER2 WT and p.R345*, and showed a further reduction relative to the RFP control group (p < 0.05). n = 20 per group. RFP, red fluorescent protein; WT, wild-type; R, arginine; E, glutamate; fs, frameshift

Acknowledgments
This image is the copyrighted work of the attributed author or publisher, and ZFIN has permission only to display this image to its users. Additional permissions should be obtained from the applicable author or publisher of the image. Full text @ J. Mol. Med.