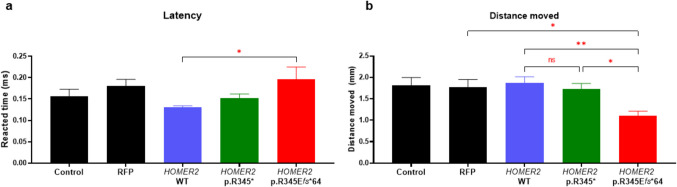
Comparison of startle reflex in zebrafish larvae at 6 days post-fertilization. a Bar graph depicting the latency (time from stimulus application to the onset of movement) across the control, RFP control, HOMER2 WT, HOMER2 p.R345*, and HOMER2 p.R345Efs*64 groups. The latency was significantly longer in the HOMER2 p.R345Efs*64 group compared to HOMER2 WT (p < 0.05). b Bar graph showing the distance moved during the startle response. The HOMER2 p.R345Efs*64 groups exhibited a significant reduction in distance moved compared to HOMER2 WT and p.R345*, and showed a further reduction relative to the RFP control group (p < 0.05). n = 20 per group. RFP, red fluorescent protein; WT, wild-type; R, arginine; E, glutamate; fs, frameshift
Acknowledgments
This image is the copyrighted work of the attributed author or publisher, and
ZFIN has permission only to display this image to its users.
Additional permissions should be obtained from the applicable author or publisher of the image.
Full text @ J. Mol. Med.
Your Input Welcome
Thank you for submitting comments. Your input has been emailed to ZFIN curators who may contact you if
additional information is required.
Oops. Something went wrong. Please try again later.