FIGURE

Fig. 7

ID
ZDB-FIG-250814-31
Publication
Han et al., 2025 - Impact of HOMER2 frameshift extension variant on auditory function and development
Other Figures
All Figure Page
Back to All Figure Page
Fig. 7

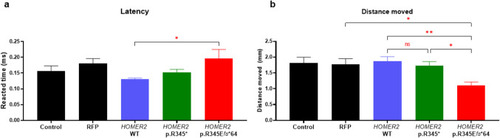
Comparison of startle reflex in zebrafish larvae at 6 days post-fertilization. a Bar graph depicting the latency (time from stimulus application to the onset of movement) across the control, RFP control, HOMER2 WT, HOMER2 p.R345*, and HOMER2 p.R345Efs*64 groups. The latency was significantly longer in the HOMER2 p.R345Efs*64 group compared to HOMER2 WT (p < 0.05). b Bar graph showing the distance moved during the startle response. The HOMER2 p.R345Efs*64 groups exhibited a significant reduction in distance moved compared to HOMER2 WT and p.R345*, and showed a further reduction relative to the RFP control group (p < 0.05). n = 20 per group. RFP, red fluorescent protein; WT, wild-type; R, arginine; E, glutamate; fs, frameshift

Expression Data

Expression Detail
Antibody Labeling
Phenotype Data

Phenotype Detail
Acknowledgments
This image is the copyrighted work of the attributed author or publisher, and ZFIN has permission only to display this image to its users. Additional permissions should be obtained from the applicable author or publisher of the image. Full text @ J. Mol. Med.