IMAGE

Fig. 6

ID
ZDB-IMAGE-250814-31
Source
Figures for Han et al., 2025
Image
Figure Caption

Fig. 6

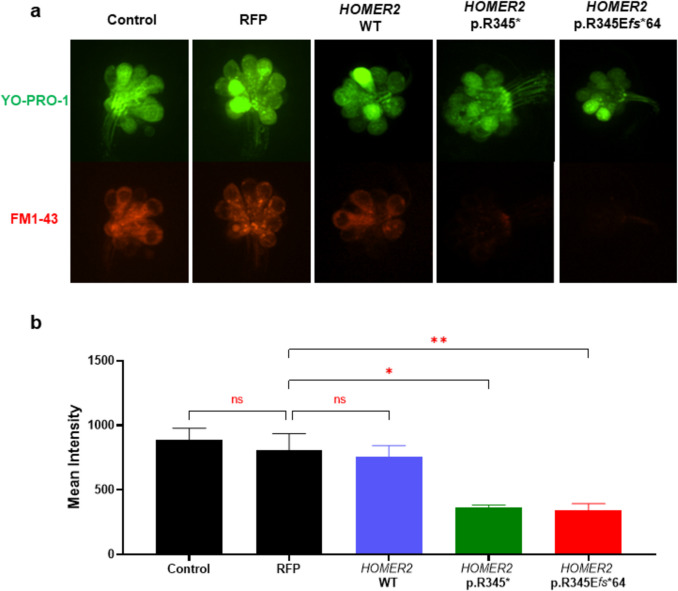
Comparison of FM1-43 uptake in zebrafish neuromast hair cells. a Representative image of neuromast hair cells in control, RFP control, HOMER2 WT, and HOMER2 variant groups. Hair cells are labeled with GFP, and FM1-43 uptake is indicated by mCherry fluorescence. b Bar graph comparing the fluorescence intensity of FM1-43 uptake across groups. While no significant differences were observed between the control, RFP, and HOMER2 WT groups, the HOMER2 variant groups showed a statistically significant reduction in intensity compared to the RFP group (*p < 0.05, **p < 0.01). n = 5 per group. RFP, red fluorescent protein; WT, wild-type

Acknowledgments
This image is the copyrighted work of the attributed author or publisher, and ZFIN has permission only to display this image to its users. Additional permissions should be obtained from the applicable author or publisher of the image. Full text @ J. Mol. Med.