
- Title
-
Phage-Antibiotic Synergy Enhances Biofilm Eradication and Survival in a Zebrafish Model of Pseudomonas aeruginosa Infection
- Authors
- Lin, L.C., Tsai, Y.C., Lin, N.T.
- Source
- Full text @ Int. J. Mol. Sci.
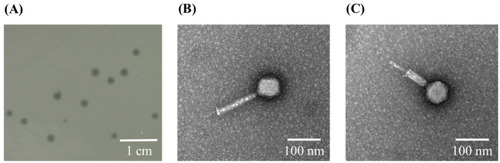
Lytic plaques and morphology of phiLCL12. ( |
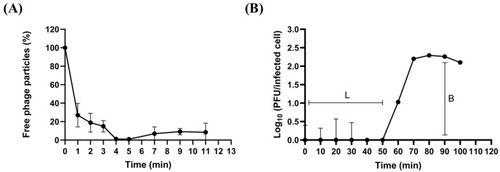
Biological characteristics of phiLCL12. ( |

Biological characteristics of phiLCL12. ( |
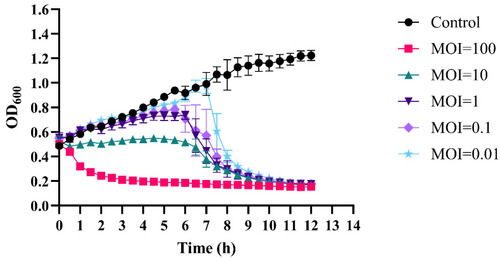
Phage–bacteria growth kinetics at different MOIs. The lytic activity of phiLCL12 against the LCL12 host was evaluated at five different MOIs. Data represent the mean of the measurements recorded every 30 min over a 12 h period, with the standard deviation (SD) indicated using error bars. Each experiment was conducted in triplicate to confirm the reliability of the results. |
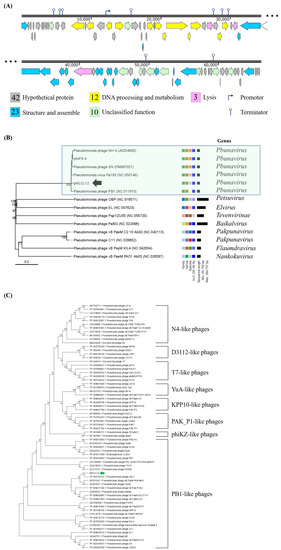
Genome map and phylogenetic analysis of phiLCL12 and related phages. ( |

Effect of combining phiLCL12 with different antibiotics. This figure illustrates the effects of phiLCL12 in combination with ( |

Biofilm clearance by combining phiLCL12 and 1/2 MIC of imipenem over time. After 12 h of |

Inhibition of biofilm formation by combining phiLCL12 and 1/2 IMP at various MOIs. |
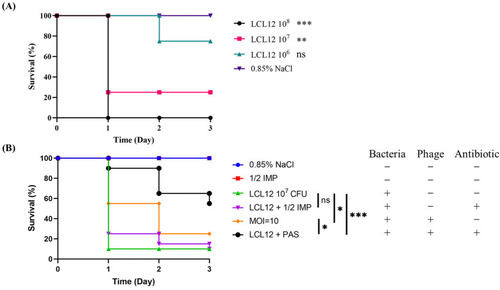
Phage–antibiotic combination therapy outperforms phage therapy alone in zebrafish rescue. ( |