FIGURE

Figure 4

ID
ZDB-FIG-250615-14
Publication
Lin et al., 2025 - Phage-Antibiotic Synergy Enhances Biofilm Eradication and Survival in a Zebrafish Model of Pseudomonas aeruginosa Infection
Other Figures
All Figure Page
Back to All Figure Page
Figure 4

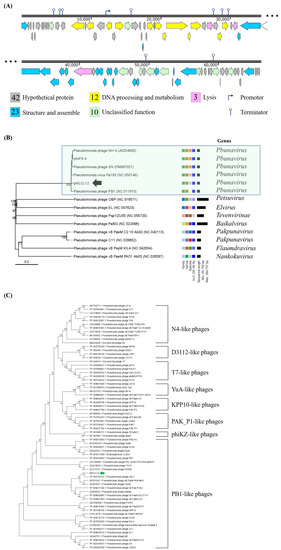
Genome map and phylogenetic analysis of phiLCL12 and related phages. (A) Genome map of phiLCL12, with the numbers inside the boxes representing the open reading frames (ORFs). Using BlastP comparisons of protein products, SnapGene 6.0.2 was used to group the phage genome into functional modules, each displayed in a different color. (B) Phylogenetic tree of phiLCL12, generated through whole-genome analysis and family classification using VICTOR (https://ggdc.dsmz.de/victor.php# (accessed on 28 March 2022)). Different colors represent various genes and species, with darker blue blocks indicating higher GC content. (C) Comparative analysis of terminase proteins from different Pseudomonas phages. The genetic relationships were analyzed using MEGA11, with ClustalW employed for sequence alignment, followed by classification with the Neighbor-Joining algorithm. The bootstrap values from 1000 replicates are shown.

Expression Data

Expression Detail
Antibody Labeling
Phenotype Data

Phenotype Detail
Acknowledgments
This image is the copyrighted work of the attributed author or publisher, and ZFIN has permission only to display this image to its users. Additional permissions should be obtained from the applicable author or publisher of the image. Full text @ Int. J. Mol. Sci.