
- Title
-
Multi-behavioral fingerprints can identify potential modes of action for neuroactive environmental chemicals
- Authors
- Herold, N.K., Gutsfeld, S., Leuthold, D., Wray, C., Spath, J., Tal, T.
- Source
- Full text @ Neurotoxicology
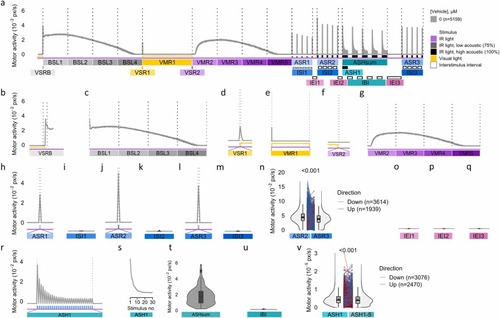
A battery of visual and acoustic assays elicits stereotyped behaviors in larval zebrafish. (a) Motor activity (y-axis) of zebrafish larvae exposed to 0.4 % DMSO for 40-min across various stimulus modalities (x-axis). Data are median ± 95 % CI for n = 5159 larvae obtained from 326 × 96-well plates each containing 24 control individuals. (b) A rapid transition from light to dark triggered a visual startle response during the baseline phase (VSRB). (c) Motor activity peaked approximately 5-min after the light-to-dark transition (BSL1), then gradually declined to baseline levels (BSL2, BSL3, BSL4). (d) A rapid dark-to-light transition caused a visual startle response (VSR1). (e) Following exposure to visual light, zebrafish larvae exhibit inactivity (VMR1). (f) Light-to-dark transition caused an additional visual startle response (VSR2). (g) Motor activity during the transition from light to dark reaches its peak around 5-min (VMR2), followed by an asymptotic decline to baseline levels (VMR3, VMR4, and VMR5). (h) Averaged spike from a series of five low- (ASR1) and (j,l) five high-intensity acoustic stimuli (1 s), provoking acoustic startle responses with low (ASR1) and high (ASR2, ASR3) amplitude, respectively. (i, k, m) Vehicle control were inactive during ISIs (ISIs) were calculated (ISI1, ISI2 and ISI3). (n) Responsiveness to non-habituating high-intensity acoustic stimuli significantly diminishes when comparing pre- (ASR2) and post-habituation (ASR3) assays, indicating the retention of memory. (o,p,q) Inter-acoustic endpoint intervals (IEI1, IEI2, IEI3). (r) A series of 30 high-intensity acoustic stimuli (interstimulus interval, ISI = 1 s) elicits an exponential decrement in response, indicative of habituation. (s) Representative plot of data used for r, excluding ISIs. (t) Aggregate sum of activity during acoustic stimulations for five habituation bouts (ASHsum). (u) Inter-habituation bout intervals (IBI). (v) Diminished responsiveness from the first (ASH1) relative to the fifth habituation bout (ASH5) indicates potentiation of habituation. Numbers above the split rainclouds in (n) and (v) represent p-values from a one-sided Wilcoxon signed-rank exact test. ASH, acoustic startle habituation; ASR, acoustic startle response; BSL, baseline motor activity; IBI, inter-bout interval; IEI, inter-endpoints interval; ISI, inter-stimulus interval; VMR, visual motor response; VSR, visual startle response; VSRB, visual startle response baseline. |
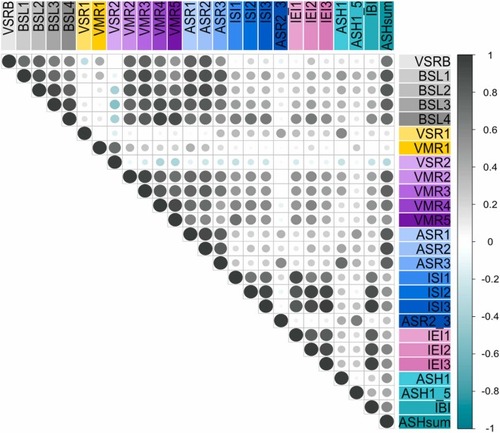
Correlation matrix of VAMR endpoints reveals relationships between VAMR NAM behavior endpoints. Based on median data from 5159 control larvae obtained from 326 × 96-well plates, the matrix displays Pearson correlation coefficients between 26 VAMR NAM endpoints. Each circle indicates the strength and direction of the correlation, with grey circles reflecting positive correlations and green circles indicating negative correlations. The size of each circle corresponds to the magnitude of the correlation. The diagonal line represents the perfect correlation (r = 1) of each endpoint with itself. Endpoints exposed to similar stimuli tend to exhibit strong correlations, as shown by the clustering of grey circles, suggesting closely related behavioral responses. |
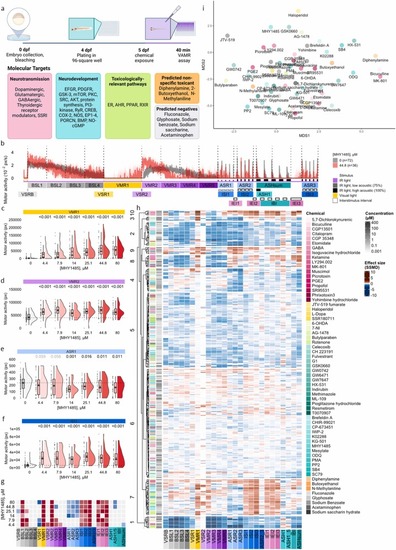
Behavioral Response of Zebrafish Larvae to Molecular Target Exposure. (a) Schematic representation of the experimental timeline. Zebrafish embryos were collected at 0 days post fertilization (dpf), plated at 4 dpf, exposed to reference chemicals on 5 dpf, then subjected to the VAMR behavior test 40-min post-exposure. Reference compounds targeted neurotransmission, neurodevelopmental signaling, toxicologically relevant pathways, and predicted non-specific toxicants and negatives. Compounds with activity in more than one functional category are displayed in yellow (neurotransmission and toxicologically relevant) or teal (neurotransmission and neurodevelopment) to reflect their dual mechanistic classifications. Color codes are consistent across panels h and i. (b) Motor activity (pixels/sec) (y-axis) over time and across 26 endpoints (x-axis) is depicted for zebrafish larvae exposed to MHY1485, an mTOR agonist (n = 36) in red, compared to untreated zebrafish larvae (n = 72) in grey. Following exposure to 4.4–80 µM MHY1485, raincloud plots quantify visual motor response under (c) illuminated and (d) non-illuminated (i.e., dark) conditions, (e) during a 1-sec acoustic startle response and (f) acoustic interstimulus interval. Horizontal dotted lines indicate the median motor activity of vehicle-exposed larvae. Numbers above the rainclouds represent adjusted p-values (grey: p ≥ 0.05, black: p < 0.05, two-sample bootstrapping test, n (vehicle) = 72, n (treatment) = 36). (g) A heatmap of p-values comparing medians to the vehicle, across tested concentrations of MHY1485 (n = 36) (y-axis) across behavioral endpoints (x-axis). Heatmap colors signify p-value comparisons to the vehicle (n = 72), with grey indicating no significant difference, while red and blue denote increased and reduced motor activity, respectively. (h) Hierarchical clustering of compound- and concentration-specific profiles (y-axis) based on effect sizes (SSMD, strictly standardized median difference) across behavioral endpoints (x-axis). Heatmap colors indicate deviation from the median control phenotype where red and blue reflect increased and reduced motor activity, respectively. (i) Multidimensional scaling (MDS) representation of pairwise distances between behavioral profiles, condensed across concentrations per chemical based on the LOEC (Lowest Observed Effect Concentration) shown in h. ASH, acoustic startle habituation; ASR, acoustic startle response; BSL, baseline motor activity; IBI, inter-bout interval; IEI, inter-endpoints interval; ISI, inter-stimulus interval; VMR, visual motor response; VSR, visual startle response; VSRB, visual startle response baseline. |

Behavioral profiling of modifiers of acoustic startle habituation (a) Hierarchical clustering of behavioral profiles across the 26-endpoint assay (x-axis) is presented for twenty-four reference chemicals that impair or accelerate acoustic startle habituation (ASH1). Heatmap colors, based on effect sizes (SSMD, strictly standardized median difference), indicate deviations from the median control phenotype. Red and blue hues represent increased and reduced motor activity, respectively (n = 32–36 larvae). (b) MDS representation of pairwise distances between behavioral profiles based on data shown in a. Fill color indicates deviation from the median control phenotype in the ASH1 endpoint where red and blue reflect reduced and enhanced habituation, respectively. Median motor activity (y-axis) of vehicle control (0.4 % DMSO, grey) and (c) Ketamine (44.8 µM, red), (d) ML-109 (7.8 8 µM, red), (e) SB4 (44.8 µM, red) exposed zebrafish larvae over 30 sequential (ISI = 1 s) high-intensity acoustic stimuli (x-axis) (shaded envelope represents the 95 % confidence interval). |
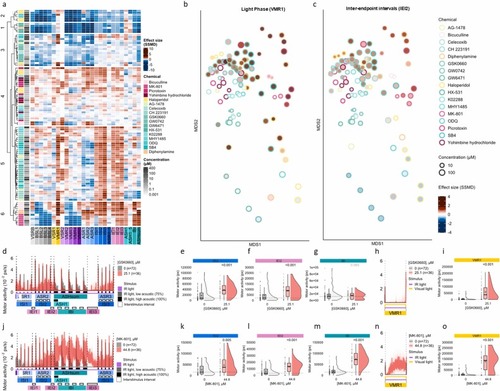
Multiple reference chemicals evoke inappropriate hyperactivity during light and interstimulus and inter-endpoint intervals (a) Hierarchical clustering of behavioral profiles across the 26-endpoint assay (x-axis) is presented for seventeen reference chemicals that generates increased locomotor activity during the light phase (VMR1), Inter Stimulus Intervals (ISI), Inter Endpoint Intervals (IEI) or Inter Bouts Intervals (IBI). Heatmap colors, based on effect sizes (SSMD), strictly standardized median difference), indicate deviations from the median control phenotype. Red and blue hues represent increased and reduced motor activity, respectively (n = 32–36 larvae). (b, c) MDS representation of pairwise distances between behavioral profiles based on data shown in a. Fill color indicates deviation from the median control phenotype in the (b) VMR1 and (c) IEI2 endpoint where red and blue reflect increase and decrease motor activity, respectively. Light phase fragment of the VAMR test, showing VMR1 endpoint for (d) GSK0660 (25.1 µM, red) and (j) MK-801 (44.8 µM, red). Acoustic fragment of the VAMR test, showing ASR1–3, ASH bouts 1–5, and interstimulus intervals (ISI1–3), as well as quiescent endpoints (IEI1–3, IBI), for (f) GSK0660 (25.1 µM, red) and (l) MK-801 (44.8 µM, red). Raincloud plots representing motor activity responses for zebrafish exposed to 0.4 % DMSO (vehicle control, grey), GSK0660 (25.1 µM, red), and MK-801 (44.8 µM, red) across the endpoints (e, k) VMR1, (g, m) ISI2, (h, n) IEI2, and (i, o) IBI. Motor activity (y-axis) is shown for each endpoint, with the horizontal dotted line indicating the median control habituation score. The adjusted p-value (from a two-sample bootstrapping test) is displayed above each raincloud plot. |

GABA receptor activity widely alters motor activity. (a) Hierarchical clustering of behavioral profiles across the 26-endpoint assay (x-axis) is presented for ten reference chemicals that target GABAA or GABAB receptors including agonists (yellow) and antagonists (purple). Heatmap colors, based on effect sizes (SSMD, strictly standardized median difference), indicate deviations from the median control phenotype. Red and blue hues represent increased and reduced motor activity, respectively (n = 32 larvae). (b) Multidimensional scaling (MDS) representation of pairwise distances between behavioral profiles, condensed across concentrations per chemical based on the LOEC (Lowest Observed Effect Concentration) shown in a. (c-h). Raincloud plots quantify the visual motor response under (c) illuminated, (d) non-illuminated (i.e., dark) conditions, (e-f) during a 1 sec acoustic startle response, (g) inter-acoustic endpoint intervals and (h) acoustic habituation sum for the GABAA receptor positive modulator Propofol, the GABAB receptor positive allosteric modulator CGP13501, and the GABAA receptor antagonists Bicuculline and Picrotoxin. Horizontal dotted lines indicate the median motor activity of vehicle-exposed larvae. Numbers above the rainclouds represent adjusted p-values (grey: p ≥ 0.05, black: p < 0.05, two-sample bootstrapping test with a Benjamin Hochberg post-hoc test, n (vehicle) = 72, n (treatment) = 36). |
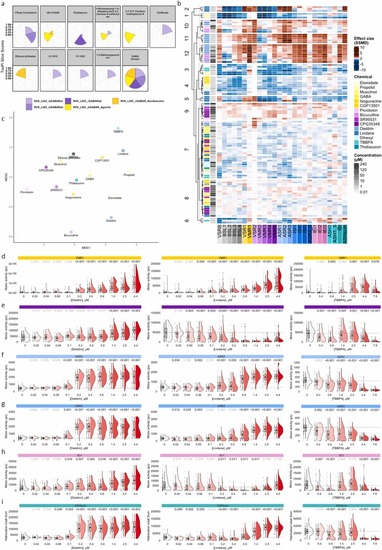
Exposure to environmental chemicals associated with GABA receptor modulation in human cellular assays or mammalian in vivo studies caused a GABA receptor behavior signature in larval zebrafish. (a) Top 10 potency profiles from GABA-relevant in vitro assays were mined from the US EPA CompTox database and AC50 values were visualize chemical effects using ToxPis where each slice reflects a unique assay and slice size indicates chemical potency. (b) Hierarchical clustering of behavioral profiles for three environmental chemicals (i.e., Thidiazuron, Dihexyl phthalate, TBBPA) that modulated GABA receptor cellular assays are highlighted in light blue shades, and two environmental chemicals that were positive for GABA receptor modulation in mammalian studies (i.e., Dieldrin and Lindane) are represented in dark blue shades. Additionally, ten reference chemicals targeting GABRs are included (Data replicated from the data shown in Fig. 3), with agonists highlighted in yellow and antagonists in purple. Assay endpoints are shown in the x-axis. Heatmap intensities, based on effect sizes (SSMD, strictly standardized median difference), indicate deviations from the median control phenotype. Red and blue hues represent increased and reduced activity, respectively (n = 23–36 larvae). (c) Multidimensional scaling (MDS) representation of pairwise distances between behavioral profiles, condensed across concentrations per chemical based on the LOEC (Lowest Observed Effect Concentration) shown in b (heatmap). Raincloud plots quantify visual motor response under (d) illuminated, (e) non-illuminated (i.e., dark) conditions, (f,g) during a 1 sec acoustic startle response and acoustic interstimulus interval (h) inter endpoint interval and (i) acoustic habituation sum for Dieldrin, Lindane, and TBBPA. Horizontal dotted lines indicate the median motor activity of vehicle-exposed larvae. Numbers above the rainclouds represent adjusted p-values (grey: p ≥ 0.05, black: p < 0.05, two-sample bootstrapping test, n (vehicle) = 72–143, n (treatment) = 23–36). |