
|
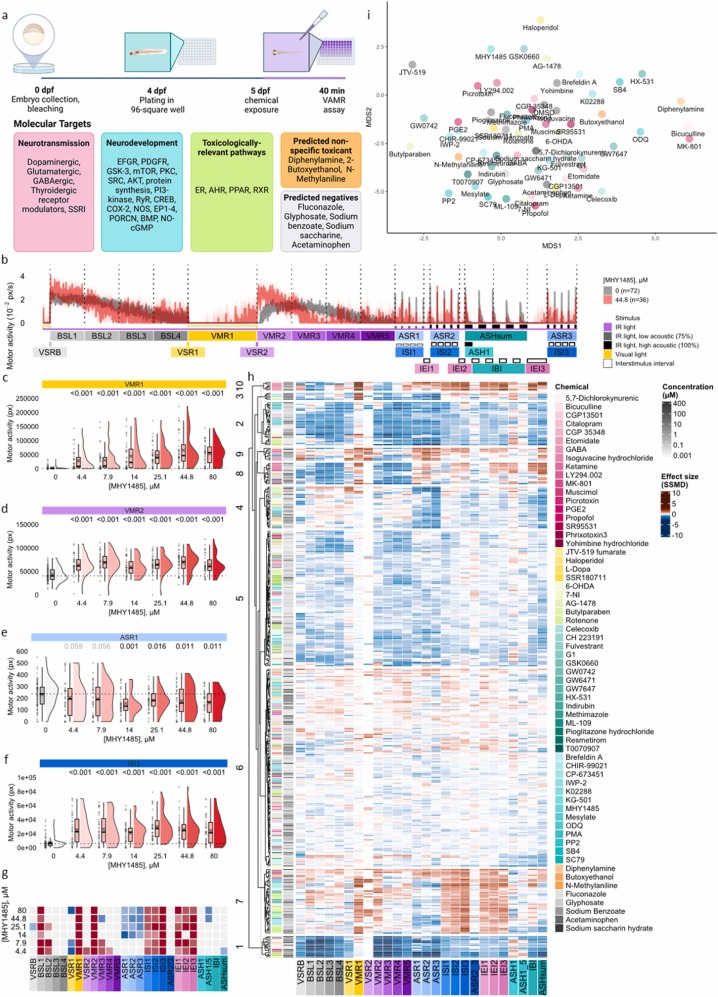
Fig. 3 Behavioral Response of Zebrafish Larvae to Molecular Target Exposure. (a) Schematic representation of the experimental timeline. Zebrafish embryos were collected at 0 days post fertilization (dpf), plated at 4 dpf, exposed to reference chemicals on 5 dpf, then subjected to the VAMR behavior test 40-min post-exposure. Reference compounds targeted neurotransmission, neurodevelopmental signaling, toxicologically relevant pathways, and predicted non-specific toxicants and negatives. Compounds with activity in more than one functional category are displayed in yellow (neurotransmission and toxicologically relevant) or teal (neurotransmission and neurodevelopment) to reflect their dual mechanistic classifications. Color codes are consistent across panels h and i. (b) Motor activity (pixels/sec) (y-axis) over time and across 26 endpoints (x-axis) is depicted for zebrafish larvae exposed to MHY1485, an mTOR agonist (n = 36) in red, compared to untreated zebrafish larvae (n = 72) in grey. Following exposure to 4.4–80 µM MHY1485, raincloud plots quantify visual motor response under (c) illuminated and (d) non-illuminated (i.e., dark) conditions, (e) during a 1-sec acoustic startle response and (f) acoustic interstimulus interval. Horizontal dotted lines indicate the median motor activity of vehicle-exposed larvae. Numbers above the rainclouds represent adjusted p-values (grey: p ≥ 0.05, black: p < 0.05, two-sample bootstrapping test, n (vehicle) = 72, n (treatment) = 36). (g) A heatmap of p-values comparing medians to the vehicle, across tested concentrations of MHY1485 (n = 36) (y-axis) across behavioral endpoints (x-axis). Heatmap colors signify p-value comparisons to the vehicle (n = 72), with grey indicating no significant difference, while red and blue denote increased and reduced motor activity, respectively. (h) Hierarchical clustering of compound- and concentration-specific profiles (y-axis) based on effect sizes (SSMD, strictly standardized median difference) across behavioral endpoints (x-axis). Heatmap colors indicate deviation from the median control phenotype where red and blue reflect increased and reduced motor activity, respectively. (i) Multidimensional scaling (MDS) representation of pairwise distances between behavioral profiles, condensed across concentrations per chemical based on the LOEC (Lowest Observed Effect Concentration) shown in h. ASH, acoustic startle habituation; ASR, acoustic startle response; BSL, baseline motor activity; IBI, inter-bout interval; IEI, inter-endpoints interval; ISI, inter-stimulus interval; VMR, visual motor response; VSR, visual startle response; VSRB, visual startle response baseline.