
|
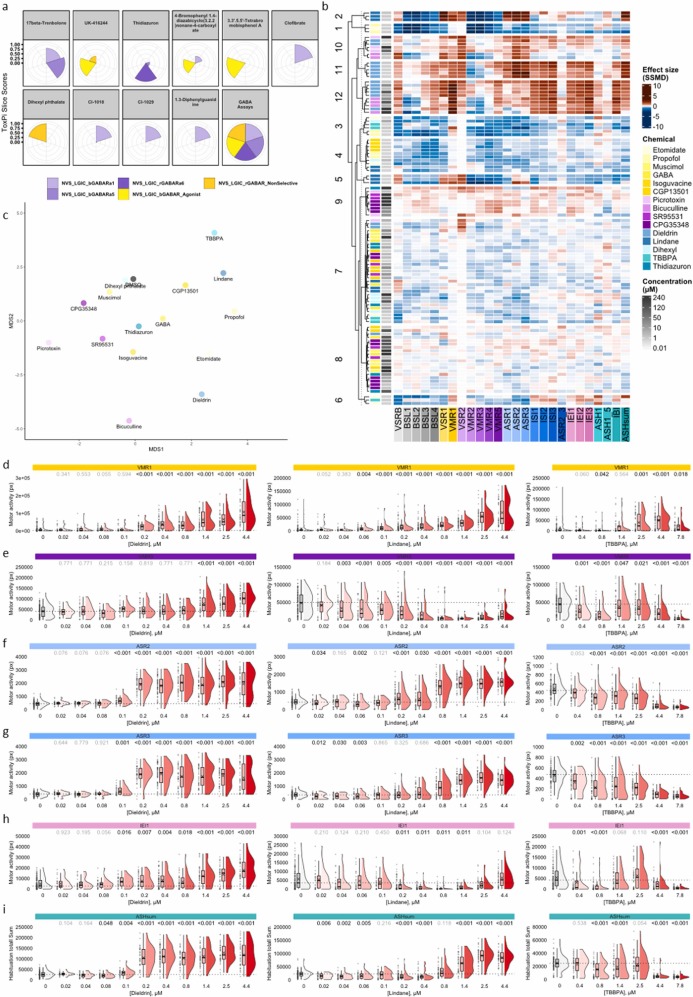
Fig. 7 Exposure to environmental chemicals associated with GABA receptor modulation in human cellular assays or mammalian in vivo studies caused a GABA receptor behavior signature in larval zebrafish. (a) Top 10 potency profiles from GABA-relevant in vitro assays were mined from the US EPA CompTox database and AC50 values were visualize chemical effects using ToxPis where each slice reflects a unique assay and slice size indicates chemical potency. (b) Hierarchical clustering of behavioral profiles for three environmental chemicals (i.e., Thidiazuron, Dihexyl phthalate, TBBPA) that modulated GABA receptor cellular assays are highlighted in light blue shades, and two environmental chemicals that were positive for GABA receptor modulation in mammalian studies (i.e., Dieldrin and Lindane) are represented in dark blue shades. Additionally, ten reference chemicals targeting GABRs are included (Data replicated from the data shown in Fig. 3), with agonists highlighted in yellow and antagonists in purple. Assay endpoints are shown in the x-axis. Heatmap intensities, based on effect sizes (SSMD, strictly standardized median difference), indicate deviations from the median control phenotype. Red and blue hues represent increased and reduced activity, respectively (n = 23–36 larvae). (c) Multidimensional scaling (MDS) representation of pairwise distances between behavioral profiles, condensed across concentrations per chemical based on the LOEC (Lowest Observed Effect Concentration) shown in b (heatmap). Raincloud plots quantify visual motor response under (d) illuminated, (e) non-illuminated (i.e., dark) conditions, (f,g) during a 1 sec acoustic startle response and acoustic interstimulus interval (h) inter endpoint interval and (i) acoustic habituation sum for Dieldrin, Lindane, and TBBPA. Horizontal dotted lines indicate the median motor activity of vehicle-exposed larvae. Numbers above the rainclouds represent adjusted p-values (grey: p ≥ 0.05, black: p < 0.05, two-sample bootstrapping test, n (vehicle) = 72–143, n (treatment) = 23–36).