
Fig. 2
- ID
- ZDB-FIG-250702-9
- Publication
- Herold et al., 2025 - Multi-behavioral fingerprints can identify potential modes of action for neuroactive environmental chemicals
- Other Figures
- All Figure Page
- Back to All Figure Page
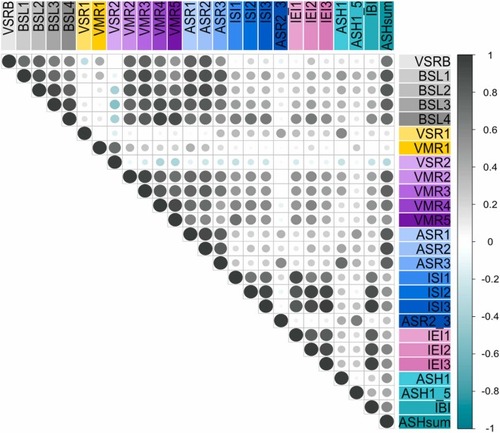
Correlation matrix of VAMR endpoints reveals relationships between VAMR NAM behavior endpoints. Based on median data from 5159 control larvae obtained from 326 × 96-well plates, the matrix displays Pearson correlation coefficients between 26 VAMR NAM endpoints. Each circle indicates the strength and direction of the correlation, with grey circles reflecting positive correlations and green circles indicating negative correlations. The size of each circle corresponds to the magnitude of the correlation. The diagonal line represents the perfect correlation (r = 1) of each endpoint with itself. Endpoints exposed to similar stimuli tend to exhibit strong correlations, as shown by the clustering of grey circles, suggesting closely related behavioral responses. |