
- Title
-
DDX24 spatiotemporally orchestrates VEGF and Wnt signaling during developmental angiogenesis
- Authors
- Chen, F., Deng, Z., Wang, X., Liu, Y., Zhao, K., Zhang, Y., He, S., Ran, R., Dong, Y., Guo, S., Zhou, Y., Zhou, B., Pang, P., Ge, W., Liu, C., Shan, H., He, H.
- Source
- Full text @ Proc. Natl. Acad. Sci. USA

Expression pattern of ddx24 in developing zebrafish. (A) Spatial visualization of ddx24 expression across zebrafish developmental stages. Data for 3.3 to 24 hpf are from Liu et al., while data for 24 to 60 hpf are from this study. (B) Relative mean expression of ddx24 across all cell types at various developmental stages. (C–J) Whole-mount in situ hybridization (WISH) showing ddx24 mRNA expression at various developmental stages. (C–F) Early embryos exhibit ubiquitous ddx24 expression. (G) Lateral view of 24 hpf embryos showing ddx24 mRNA expressed in the head and trunk. (G′) Magnified view of the trunk region from (G), highlighting enriched ddx24 expression in the vasculature. Arrowheads indicate the trunk vessels. (H) Transverse sections of the embryo trunk from (G) showing the vascular expression of ddx24. DA, dorsal aorta; PCV, posterior cardinal vein; NT, neural tube; NC, notochord; P, pronephric duct. (I and J) At 36 and 60 hpf, ddx24 expression is restricted to the brain and heart regions. (I′), Magnified view of the head region in (I). Arrowheads indicate the brain in (I′) and the heart in (J). (K), Quantitative real-time PCR (qRT-PCR) analysis of ddx24 mRNA expression in whole embryos, as well as in the head and trunk, during development. (L and M), Fluorescence WISH for ddx24 (red) combined with anti-EGFP staining (green) in Tg(fli1a:EGFP)y1 embryos. Colocalization of ddx24 and EGFP in the trunk vasculature at 24 hpf (L) and brain vasculature at 36 hpf (M). ISV, intersegmental vessels; PHBC, primordial hindbrain channels; CtA, central artery. In (L), the solid arrow indicates ISVs, while the hollow arrow indicates the DA and PCV. In (M), the solid arrow indicates tip cells of CtAs, while the hollow arrow indicates PHBC. (N and O), qRT-PCR of ddx24 mRNA in both GFP+ and GFP- cells from Tg(fli1a:EGFP)y1 transgenic embryos at 24 and 36 hpf. kdrl mRNA serves as a positive control for vascular endothelial cells. [Scale bars, 200 μm in (A and C–J), 20 μm in (L and M).] Data are represented as mean ± SD. **P < 0.01, ***P < 0.001 and ****P < 0.0001, as assessed by parametric two-tailed Student’s t test. |
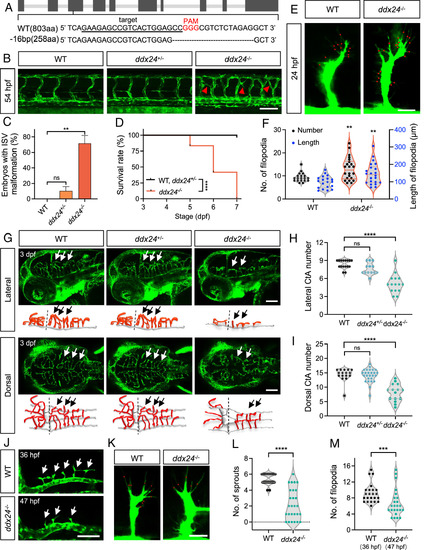
Loss of Ddx24 promotes endothelial cell branching in the trunk and impairs sprouting in the brain of zebrafish. (A) CRISPR/Cas9 target site in ddx24 locus with 16-bp deletion (PAM in red). (B) Representative confocal images of trunk vasculature in WT, ddx24+/-, and ddx24−/− embryos at 54 hpf. Red arrowheads indicate ectopic ISV branches. (C) Quantification of the embryo with ectopic ISV branches. n = 29, 40, 23 embryos. (D) Kaplan–Meier survival curves of WT, ddx24+/-, and ddx24−/− zebrafish. n = 18, 36, 12 embryos. (E) Representative high-magnification confocal images of ISV sprouts in WT and ddx24−/− embryos at 24 hpf. The red dots point to the tip cell filopodia. (F) Quantification of filopodia number and length. n = 19 for WT, n = 22 for ddx24−/− embryos. (G) Representative confocal images and schematic diagram of hindbrain vasculature in WT, ddx24+/-, and ddx24−/− embryos at 3 dpf. Arrows indicate CtAs. (H and I), Quantification of CtAs. Lateral view number of CtAs (H, n = 16, 13, 15 embryos) and dorsal view number of CtAs (I, n = 16, 26, 15 embryos) were determined. (J) Representative confocal images of hindbrain vasculature in WT (36 hpf) and ddx24−/− (47 hpf) embryos. Arrows indicate CtAs. (K) Representative high-magnification confocal images of CtA sprouts in WT (36 hpf) and ddx24−/− (47 hpf) embryos. The red dots point to the tip cell filopodia. (L and M), Quantification of CtA sprouts (L, n = 24, 27 embryos) and filopodia per CtA (M, n = 23, 24 embryos). [Scale bars, 100 μm in (B, G, and J); 20 μm in (E and K).] Data are represented as mean ± SD. ns, not significant, **P < 0.01, ***P < 0.001 and ****P < 0.0001, as assessed by one-way ANOVA (C), log-rank (Mantel–Cox) test (D) parametric two-tailed Student’s t test (F), nonparametric Kruskal–Wallis test (H and I) and nonparametric Mann–Whitney test (L and M). |
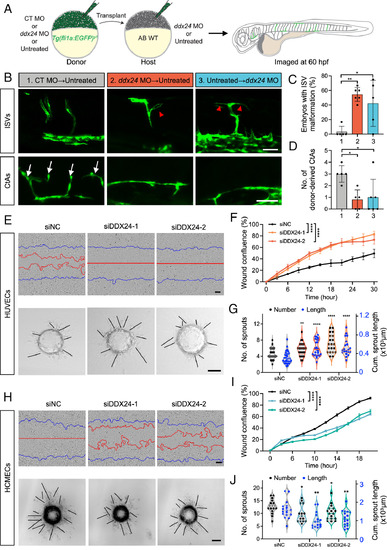
DDX24 regulates developmental angiogenesis both EC-autonomously and nonautonomously. (A) Schematic diagram of the embryonic transplantation experiment to evaluate the cell-autonomous role of DDX24 in angiogenesis. (B) Representative confocal images of mosaic ISVs and CtAs at 60 hpf. Red arrowheads indicate ectopic ISV branches; white arrows indicate CtAs. (C) Quantification of ectopic branching in EGFP-labeled ISVs from transplanted embryos. n = 26, 22, 19 embryos from 5 or 6 experiments. (D) Quantification of donor-derived CtAs in transplanted embryos. n = 5, 5, 6 CtAs. 1, CT MO → Untreated; 2, ddx24 MO → Untreated; 3, Untreated → ddx24 MO. (E) Representative brightfield images of wound healing assays (Top panels) and 3D sprouting assays (Bottom panels) in HUVECs transfected for 36 h with DDX24 siRNA (siDDX24) or control siRNA (siNC). Blue lines indicate the initial scratch wound outlines and red lines indicate the scratch wound outlines at 18 h post scratch. (F) Quantification of wound healing assays in HUVECs. (G) Quantification of the number and length of sprouts in HUVECs. n = 34, 25, 20 beads from three experiments. (H) Representative brightfield images of wound healing assays (Top panels) and 3D sprouting assays (Bottom panels) in HCMECs transfected for 36 h with DDX24 siRNA (siDDX24) or control siRNA (siNC). The blue lines indicate the initial scratch wound outlines, the red lines indicate the scratch wound outlines at 16 h after the scratching. (I) Quantification of wound healing assays in HCMECs. (J) Quantification of the number and length of sprouts in HCMECs. n = 17, 15, 17 beads from three experiments. [Scale bars, 50 μm in (B), 100 μm in (E and H).] Data are represented as mean ± SD. *P < 0.05, **P < 0.01 and ****P < 0.0001, as assessed by one-way ANOVA (C, G-length, J-length), nonparametric Kruskal–Wallis test (D, G-number, J-number), and two-way ANOVA (F and I). |

DDX24 regulates brain and trunk angiogenesis through the Wnt and VEGF pathways, respectively. (A) GO analysis showing the top fold-change enriched terms in HUVECs upon DDX24 knockdown. (B) Fold change of VEGF pathway genes upon DDX24 deficiency in HUVECs and HCMECs. (C) Western blot analysis of the indicated antibodies in HUVECs transfected with control or DDX24 siRNA. Protein levels were normalized to β-actin. n = 3 independent experiments. (D) qRT-PCR analysis of DDX24 and KDR in HUVECs transfected with siNC or siDDX24. (E) qRT-PCR analysis of ddx24 and kdr/kdrl in WT or ddx24−/− zebrafish. (F) Quantification of the ectopic branch of ISV at 54 hpf following injection with CT MO, ddx24 MO, and ddx24 MO + kdr/kdrl MO. n = 36, 38, 37 embryos. (G) Quantification of CtA number at 36 hpf following injection with CT MO, ddx24 MO, and ddx24 MO + kdr/kdrl MO. n = 23, 24, 26 embryos. (H) RNA immunoprecipitation (RIP) followed by RT-qPCR showing enrichment of KDR mRNA by anti-DDX24 antibody in HUVECs. RPL12 mRNA served as a negative control. (I) Predicted top three binding sites and binding motif between DDX24 and KDR mRNA. (J) The percentage of remaining KDR mRNA was tested after the addition of actinomycin D. (K) Fold change of Wnt pathway genes upon DDX24 deficiency in HCMECs and HUVECs. (L) Wnt signaling activity in HCMECs measured by TOPFlash luciferase reporter assay. (M) Western blot analysis of DDX24 and GPR124 in HCMECs transfected with siNC or siDDX24. Protein levels were normalized to β-actin. (N) qRT-PCR analysis of gpr124/reck and Wnt target genes in the head of 36 hpf WT or ddx24−/− zebrafish. (O) Quantification of CtA number at 36 hpf following injection of CT MO, ddx24 MO, or ddx24 MO combined with WT or ∆ICD gpr124 mRNA. n = 38, 40, 40, 40 embryos. All the data are representative of at least three independent experiments. Data are represented as mean ± SD. ns, not significant, *P < 0.05, **P < 0.01, ***P < 0.001 and ****P < 0.0001, as assessed by one-way ANOVA (C, D, L, and M), nonparametric Kruskal–Wallis test (F, G, and O), parametric two-tailed Student’s t test (E, H, and N) and two-way ANOVA (J). |
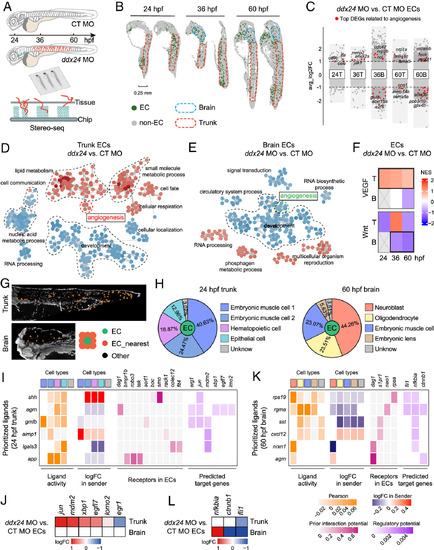
The spatiotemporal signaling network in ECs mediated by Ddx24. (A) Schematic overview of Stereo-seq in control and ddx24 morphant zebrafish embryos. (B) Spatial visualization of ECs at 24 and 60 hpf. Blue dashed lines outline brain regions, and red dashed lines outline trunk regions. (C) Volcano plot of DEGs between Ddx24-deficient and control ECs. The top DEGs related to angiogenesis are indicated in red. T, Trunk. B, Brain. (D and E) GO term similarity network colored by expression changes in 24 hpf ddx24 MO vs. CT MO ECs. Red dots indicating upregulated terms, and blue dots indicating downregulated terms. (F) Heatmap showing activation changes of VEGF and Wnt pathways in trunk and brain ECs upon Ddx24 depletion. T, Trunk. B, Brain. (G) Identification of ECs and their nearest neighboring spots. (H) Annotation of neighboring cell types surrounding ECs and statistics of cell-type proportions. (I) NicheNet analysis identifying top-ranked ligands in neighboring cells (senders) and their predicted angiogenesis-related target genes in 24 hpf trunk ECs. Neighboring cell types are color-coded as shown in (H). (J) Expression changes of angiogenesis-related target genes in trunk and brain ECs at 24 hpf. (K) NicheNet analysis identifying top-ranked ligands in neighboring cells (senders) and their predicted angiogenesis-related target genes in 60 hpf brain ECs. Neighboring cell types are color-coded as shown in (H). (L) Changes in the expression of target genes related to angiogenesis in 60 hpf trunk and brain ECs. PHENOTYPE:
|

Sequential targeting of the VEGF and Wnt pathways attenuates VMs in Ddx24-deficient zebrafish. (A) Representative confocal images of trunk vessels of 60 hpf control or ddx24 morphant embryos treated with DMSO or regorafenib from 20 to 60 hpf. Red arrowheads indicate ectopic ISV branches. (B and C), Quantification of the ectopic ISV branches (B, n = 41, 42, 36, 40 embryos) and CtA number (C, n = 30, 30, 31, 29 embryos). (D) Representative confocal microscopy images of hindbrain vasculature in 72 hpf control and ddx24 morphant embryos treated with either DMSO or Wnt signaling activators (CHIR-99021 and BML-284) from 5 to 72 hpf. Arrows indicate CtAs. (E) Expression of Wnt target gene determined by qRT-PCR. (F and G) Quantification of CtA number (F, n = 27, 18, 20, 28 embryos) and ectopic ISV branches (G, n = 25, 30, 33, 19 embryos). (H) Schematic representation of the experimental schedule for regorafenib (Rego) and CHIR-99021 (CHIR) treatment in control or ddx24 morphants. (I) Schematic representation of the experimental schedule for regorafenib (Rego) and CHIR-99021 (CHIR) treatment in WT or ddx24 crispants. (J and K), Quantification of ectopic ISV branches (J, n = 34, 39, 33, 38 embryos) and CtA number (K, n = 29, 36, 21, 22 embryos) after drug treatment in (H). (L and M), Quantification of ectopic ISV branches (L, n = 25, 25, 25, 26, 26 embryos) and CtA number (M, n = 21, 23, 24, 22, 25 embryos) after drug treatment in (I). (Scale bars, 100 μm.) Data are represented as mean ± SD. ns, not significant, *P < 0.05, **P < 0.01, ***P < 0.001 and ****P < 0.0001, as assessed by nonparametric Kruskal–Wallis test (B, C, F, G, and J–M) and one-way ANOVA (E). EXPRESSION / LABELING:
PHENOTYPE:
|