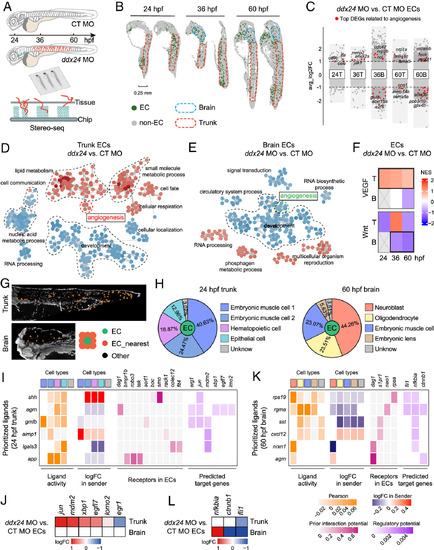
The spatiotemporal signaling network in ECs mediated by Ddx24. (A) Schematic overview of Stereo-seq in control and ddx24 morphant zebrafish embryos. (B) Spatial visualization of ECs at 24 and 60 hpf. Blue dashed lines outline brain regions, and red dashed lines outline trunk regions. (C) Volcano plot of DEGs between Ddx24-deficient and control ECs. The top DEGs related to angiogenesis are indicated in red. T, Trunk. B, Brain. (D and E) GO term similarity network colored by expression changes in 24 hpf ddx24 MO vs. CT MO ECs. Red dots indicating upregulated terms, and blue dots indicating downregulated terms. (F) Heatmap showing activation changes of VEGF and Wnt pathways in trunk and brain ECs upon Ddx24 depletion. T, Trunk. B, Brain. (G) Identification of ECs and their nearest neighboring spots. (H) Annotation of neighboring cell types surrounding ECs and statistics of cell-type proportions. (I) NicheNet analysis identifying top-ranked ligands in neighboring cells (senders) and their predicted angiogenesis-related target genes in 24 hpf trunk ECs. Neighboring cell types are color-coded as shown in (H). (J) Expression changes of angiogenesis-related target genes in trunk and brain ECs at 24 hpf. (K) NicheNet analysis identifying top-ranked ligands in neighboring cells (senders) and their predicted angiogenesis-related target genes in 60 hpf brain ECs. Neighboring cell types are color-coded as shown in (H). (L) Changes in the expression of target genes related to angiogenesis in 60 hpf trunk and brain ECs.
|
