
- Title
-
G protein-coupled receptor GPR182 negatively regulates sprouting angiogenesis via modulating CXCL12-CXCR4 axis signaling
- Authors
- Chen, C., Liu, W., Yuan, F., Wang, X., Xu, X., Ling, C.C., Ge, X., Shen, X., Li, B., Shen, Y., Liu, D.
- Source
- Full text @ Angiogenesis
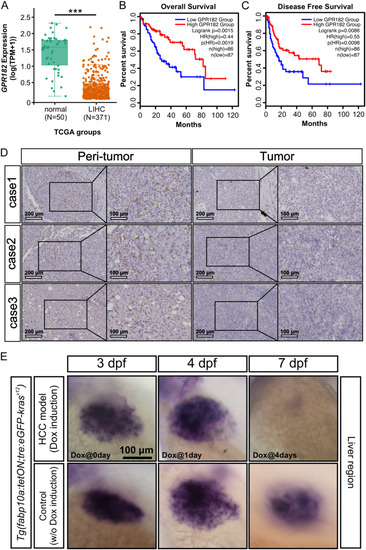
Downregulation of |
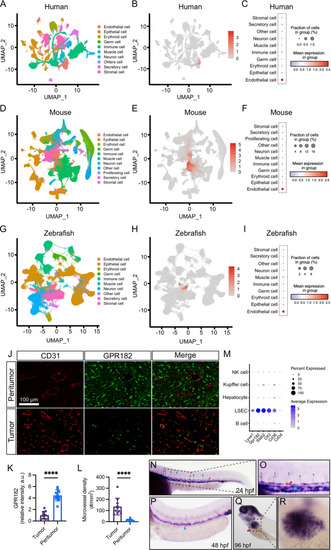
Comparative expression of GPR182 across species. |

Gpr182 deficiency promotes sprouting angiogenesis in zebrafish embryos. |
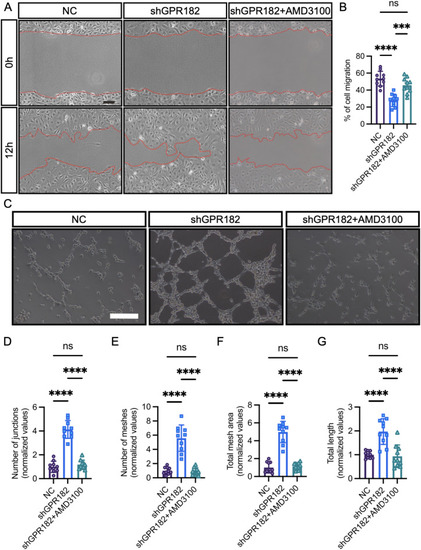
Loss of GPR182 promotes EC migration and tube formation. |
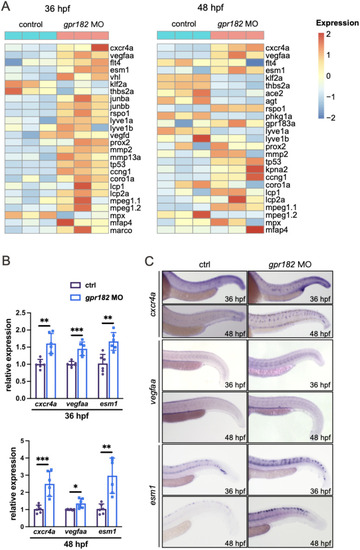
Whole-genome transcriptomic profiling of control embryos and |

GPR182 does not trigger downstream signaling in response to CXCL12. |

GPR182 modulates CXCR4 signaling through internalizing CXCL12. |
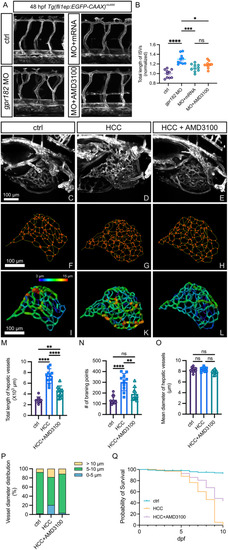
Inhibition of CXCR4 signaling normalizes the vasculature in |
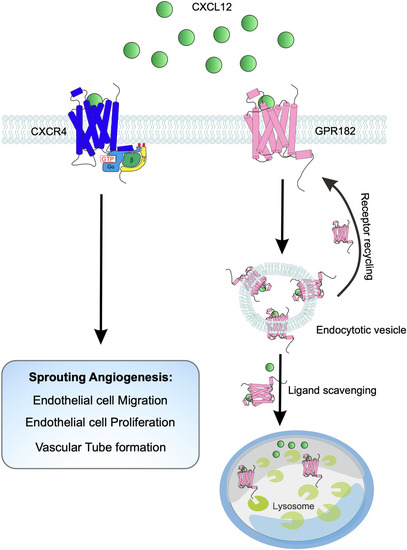
Schematic overview of GPR182’s role in regulating sprouting angiogenesis. This illustration depicts how GPR182 functions as a chemokine scavenger to modulate the CXCL12/CXCR4 signaling axis, thereby controlling the process of sprouting angiogenesis |