IMAGE

Fig. 6

ID
ZDB-IMAGE-250505-119
Source
Figures for Chen et al., 2025
Image
Figure Caption

Fig. 6

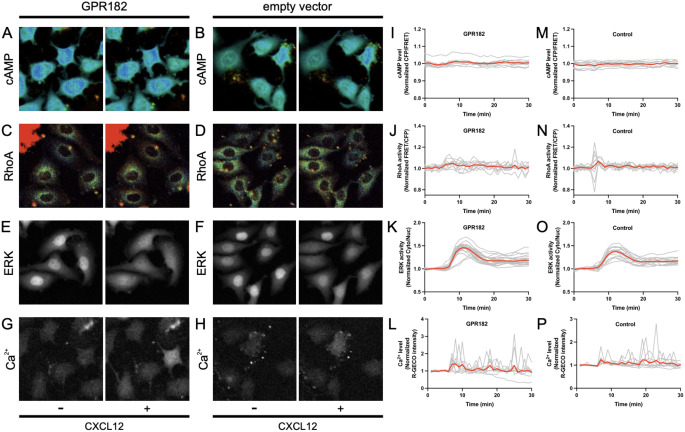
GPR182 does not trigger downstream signaling in response to CXCL12. (A and G) and (B and H), HeLa/cAMP/Ca2 + cells expressing GPR182 or an empty vector were treated with CXCL12. (C and D) and (E and F), HeLa/RhoA/ERK cells expressing GPR182 or an empty vector were treated with CXCL12. The addition CXCL12 starts at 5 min. Representative images of different biosensors before (left) and after (right) the stimulation of CXCL12. The response of the biosensors for cAMP levels (I and M), RhoA activity (J and N), ERK activity (K and O), and Ca2 + levels (L and P) is normalized by dividing by the averaged value before stimulation and plotted as a function of elapsed time after stimulation. The red and gray lines represent the time-course for the average and individual cells, respectively

Acknowledgments
This image is the copyrighted work of the attributed author or publisher, and ZFIN has permission only to display this image to its users. Additional permissions should be obtained from the applicable author or publisher of the image. Full text @ Angiogenesis