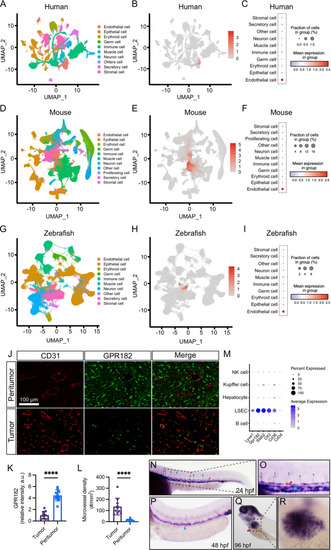
Comparative expression of GPR182 across species. (A, D, G) UMAP visualizations depict the distribution of GPR182 in the Human, Mouse, and Zebrafish cell atlases, respectively. (B, E, H) Relative distribution patterns of GPR182 across various cell clusters in Human, Mouse, and Zebrafish. (C, F, I) Mean expression levels of GPR182 within distinct cell clusters for each species. (J) Immunofluorescence staining of peritumoral and tumoral regions in HCC sections showing expressions of CD31 (a pan-endothelial marker) and GPR182. (K and L) Quantitative analysis of GPR182 expression intensity and microvessel density in peritumoral and tumoral regions of HCC sections (n = 10). Data are presented as mean ± SD, with statistical significance determined by Student’s t-test. ****, p < 0.0001. (M) Expression profiling of LSEC-specific markers in liver cell populations. (N-R) Whole-mount in situ hybridization of embryos reveals high gpr182 expression in the zebrafish vascular system and liver. The hybridization signals in developing ISVs, PCV, DA, and liver are indicated by green, blue, red, and magenta arrowheads, respectively
|
