FIGURE SUMMARY
Title

Pancreatic exocrine damage induces beta cell stress in zebrafish larvae

Authors
Faraj, N., Hoogaars, W.M.H., Duinkerken, B.H.P., Wolters, A.H.G., Kats, K., Dekkers, M.C., Zaldumbide, A., Giepmans, B.N.G.
Source
Full text @ Diabetologia

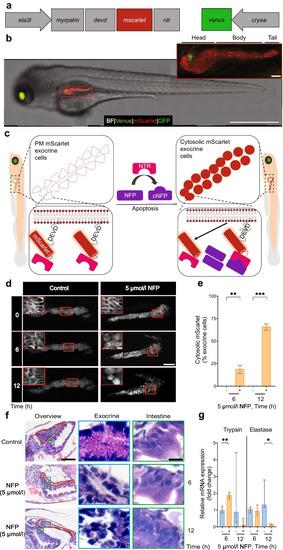
Modulation of exocrine damage in a transgenic zebrafish. (a) Schematic of the transgene cloned into the Tol2 plasmid to generate the Tg(ela3l:myrpalmdevd-mscarlet-ntr;cryaa:venus) zebrafish, Tg(ela3l:ntr). NTR-mScarlet is exclusively targeted to all exocrine plasma membranes through a short myristylation and palmitoylation sequence (myrpalm), under control of the elastase A promoter. A devd caspase cleavage site sequence is located in between myrpalm and mscarlet-ntr. Additionally, venus under control of the cryaa promoter is included for selection of transgenic zebrafish. (b) Representative example of the presence of mScarlet+ exocrine plasma membrane, Venus+ lens and GFP+ beta cells in double Tg(ela3l-ntr;insulin:gfp) zebrafish larvae at 108 hpf. Scale bar, 1 mm. The magnified image shows mScarlet signal in the three different pancreas portions: head, body and tail, surrounding GFP+ beta cells. Scale bar, 50 µm. (c) The genetic/chemical NTR–NFP modulation approach. After NFP administration, NTR enzyme transforms NFP into the cytotoxic agent cNFP, leading to apoptosis and caspase activation shown by the translocation of mScarlet from the exocrine plasma membrane to the cytosol. (d) Confocal images of mScarlet signal, showing the translocation of mScarlet after 5 µmol/l NFP on NTR+ exocrine cells over time; control: 0 µmol/l NFP in 0.1% DMSO. Scale bar, 50 μm or 5 µm (magnified image). (e) Cytosolic mScarlet+ exocrine cell percentage in response to the induced exocrine damage caused by 5 µmol/l NFP treatment (n=3 each). (f) H&E staining of larvae sections showing morphological changes of exocrine cells post-damage. Red lines indicate the pancreas, blue boxes indicate the exocrine regions and green boxes indicate the intestinal regions as control (n=6 per group). Scale bar, 100 µm or 10 µm (magnified image). (g) qPCR analysis of pooled samples of zebrafish larvae showing normalised relative mRNA expression levels of elastase and trypsin with 5 µmol/l NFP (n=3). Data represent the median values with bars indicating the range from the maximum to the minimum data points. Unpaired t test was used for statistical differences between groups. *p<0.05, **p<0.01, ***p<0.001. Fig. 1c is created in BioRender. Faraj, N. (2025) https://BioRender.com/d22a265. PM, plasma membrane

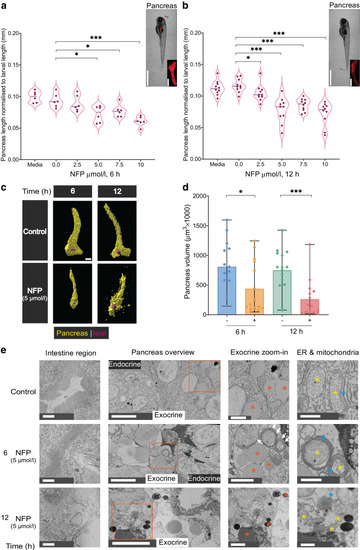
Exocrine damage induces morphological changes and reduces pancreas volume in zebrafish. (a, b) The pancreas length was measured and normalised to the whole larval length using mScarlet signal after different NFP concentrations and exposure times of 6 h (a) and 12 h (b), along with media and control (0 µmol/l NFP in 0.1% DMSO) samples (n=6 or n=10, respectively). Scale bar, 1 mm or 50 µm (magnified image). Unpaired t test was used for statistical differences between groups: *p<0.05, ***p<0.001. (c) The impact of 5 µmol/l NFP on pancreas volume in the double Tg(ela3l:ntr;insulin:gfp) line. Yellow represents mScarlet signal in pancreas; magenta represents the islet portion. Scale bar, 50 µm. (d) Bar plots showing the changes in pancreas volume (µm3) post-NFP treatment (n=15 each). Data represent the mean values with bars indicating the range from the maximum to the minimum data points. Mann–Whitney U test was used for statistical differences between groups: *p<0.05, ***p<0.001. (e) Electron microscopy images showing ultrastructural alterations within the intestine and pancreas region; the exocrine magnification (zoom-in) and ER and mitochondria images indicate different cellular structural abnormalities (granules, ER whorls, distorted mitochondria) in Tg(ela3l:ntr). Orange asterisks indicate exocrine granules; blue asterisks indicate ER; white arrows indicate ER whorls; yellow asterisks indicate mitochondria. Scale bar, 2 µm (intestine and exocrine zoom-in), 5 µm (pancreas overview) and 1 µm (ER and mitochondria). Full electron microscopy data are available via http://www.nanotomy.org/OA/Faraj2025Diabetologia/ and at the BioImage Archive (S-BIAD1479, DOI: https://doi.org/10.6019/S-BIAD1479)

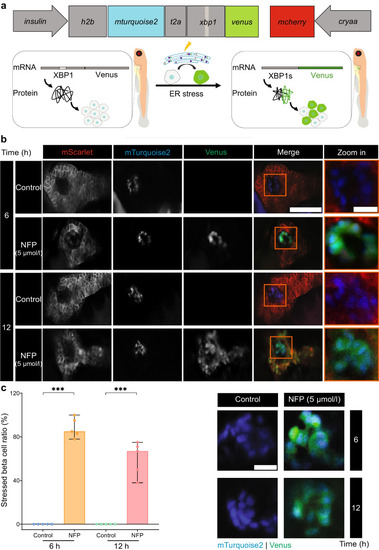
Exocrine damage induces ER stress in beta cells. (a) Schematic showing the ER stress reporter under the beta cell-specific insulin promoter; venus is fused with xbp1, which under normal conditions remains unspliced, resulting in only mTurquoise2+ nuclei. Upon ER stress, XBP1s is produced with Venus being in frame and causing stressed beta cells to display mTurquoise2+ nuclei and Venus+ cytosol in Tg(insulin:h2b-mturquoise.2-xbp1-venus;cryaa:mcherry) larvae, briefly Tg(insulin:xbp1v). Additionally, mcherry under the cryaa promoter is included to facilitate the selection of positive transient zebrafish. (b) The expression of mTurquoise2 and Venus in beta cells after exocrine damage stimulation by 5 µmol/l NFP. Scale bar, 50 μm or 10 µm (magnified image). (c) Quantification of the ratio of stress beta cells to the total number of beta cells after 6 and 12 h of NFP treatment (n=5 each). The representative images were used for quantification. Scale bar, 10 µm. Data represent the median values with bars indicating the range from the maximum to the minimum data points. Unpaired t test was used for statistical differences between groups. ***p<0.001. Part of Fig. 3a is created in BioRender. Faraj, N. (2025) https://BioRender.com/z06r241

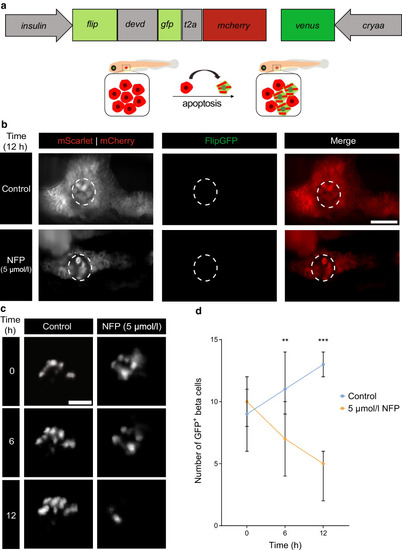
Reduced number of GFP+ beta cells with absence of apoptosis post-exocrine damage. (a) Apoptosis reporter under the beta cell-specific insulin promoter mCherry labels the cytosol of all beta cells. A DEVD caspase cleavage site sequence separates the two β sheets of GFP from each other, resulting in GFP signal loss under normal conditions. Upon apoptosis activation, cleavage of DEVD induces a conformational change within GFP that results in high GFP brightness. (b) Light sheet fluorescence images show the presence of mCherry within beta cells without GFP signal after exocrine damage and mScarlet displacement. Scale bar, 50 µm. (c) Confocal fluorescence imaging displaying GFP+ beta cells within the pancreas over time following NFP treatment. Scale bar, 25 µm. (d) Quantification of GFP+ beta cells in Tg(ela3l:ntr;insulin:gfp) larvae at 0, 6 and 12 h after treatment with 5 µmol/l NFP or under control (0 µmol/l NFP in 0.1% DMSO) conditions (n=5). Scale bar, 25 µm. Data represent the median values with bars indicating the range from the maximum to the minimum data points. Unpaired multiple t tests were used for statistical differences between groups. **p<0.01, ***p<0.001. Part of Fig. 4a is created in BioRender. Faraj, N. (2025) https://BioRender.com/l19l254

Reduced islet volume and decreased numbers of insulin-producing beta cells following exocrine damage. (a) 3D reconstruction of GFP+ beta cells and the islet volume measurement after 5 µmol/l NFP treatment. Scale bar, 25 µm. (b) Bar blots demonstrating the impact of NFP on the islet volume in Tg(ela3l:ntr;insulin:gfp) larvae (n=15 each). Data represent the mean values with bars indicating the range from the maximum to the minimum data points. Mann–Whitney U test was used for statistical differences between groups: **p<0.01. (c) Experimental schematic for imaging insulin-labelled Tg(ela3l:ntr;insulin:gfp) at 96 hpf after 6 and 12 h of NFP treatment followed by 12 h of medium without NFP (recovery time). (d, e) 3D reconstruction of insulin immunofluorescent staining and DAPI staining at 120 hpf in whole larvae following NFP treatment (n=5). Scale bar, 100 µm. Data represent the median values with bars indicating the range from the maximum to the minimum data points. Unpaired t test was used for statistical differences between groups:, ***p<0.001. Fig. 5c is created in BioRender. Faraj, N. (2025) https://BioRender.com/g20u364

Acknowledgments
This image is the copyrighted work of the attributed author or publisher, and ZFIN has permission only to display this image to its users. Additional permissions should be obtained from the applicable author or publisher of the image. Full text @ Diabetologia