IMAGE

Fig. 4

ID
ZDB-IMAGE-250714-100
Source
Figures for Faraj et al., 2025
Image
Figure Caption

Fig. 4

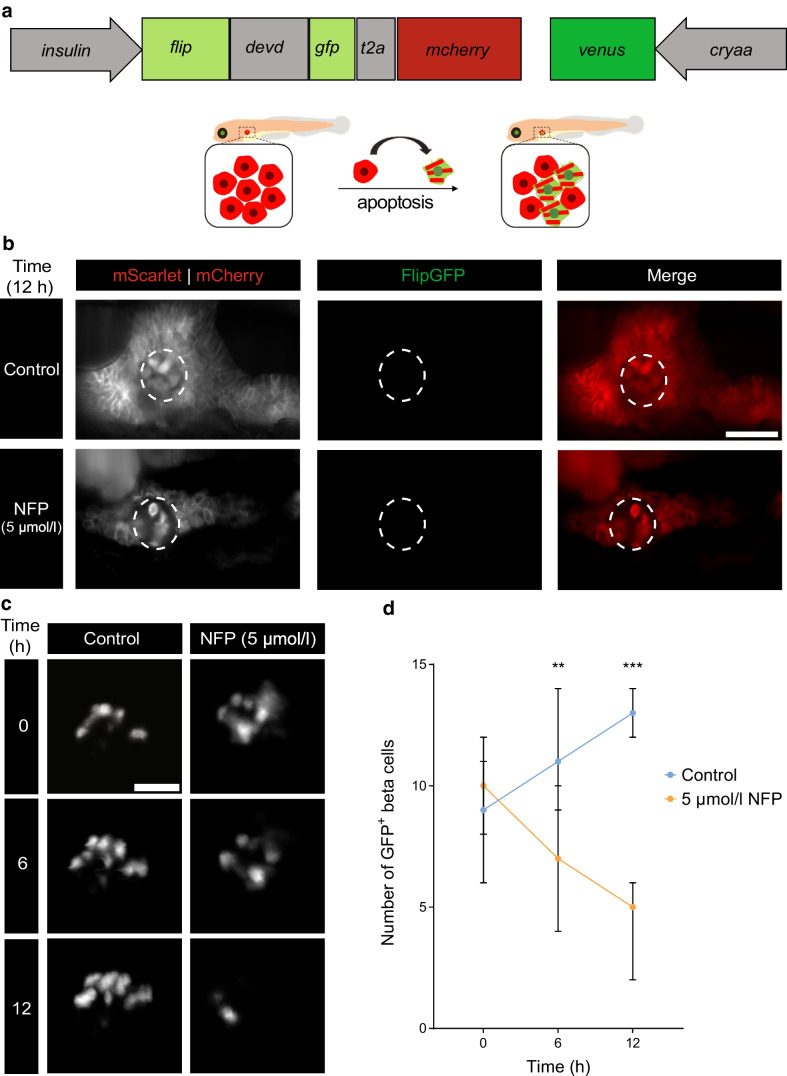
Reduced number of GFP+ beta cells with absence of apoptosis post-exocrine damage. (a) Apoptosis reporter under the beta cell-specific insulin promoter mCherry labels the cytosol of all beta cells. A DEVD caspase cleavage site sequence separates the two β sheets of GFP from each other, resulting in GFP signal loss under normal conditions. Upon apoptosis activation, cleavage of DEVD induces a conformational change within GFP that results in high GFP brightness. (b) Light sheet fluorescence images show the presence of mCherry within beta cells without GFP signal after exocrine damage and mScarlet displacement. Scale bar, 50 µm. (c) Confocal fluorescence imaging displaying GFP+ beta cells within the pancreas over time following NFP treatment. Scale bar, 25 µm. (d) Quantification of GFP+ beta cells in Tg(ela3l:ntr;insulin:gfp) larvae at 0, 6 and 12 h after treatment with 5 µmol/l NFP or under control (0 µmol/l NFP in 0.1% DMSO) conditions (n=5). Scale bar, 25 µm. Data represent the median values with bars indicating the range from the maximum to the minimum data points. Unpaired multiple t tests were used for statistical differences between groups. **p<0.01, ***p<0.001. Part of Fig. 4a is created in BioRender. Faraj, N. (2025) https://BioRender.com/l19l254

Acknowledgments
This image is the copyrighted work of the attributed author or publisher, and ZFIN has permission only to display this image to its users. Additional permissions should be obtained from the applicable author or publisher of the image. Full text @ Diabetologia