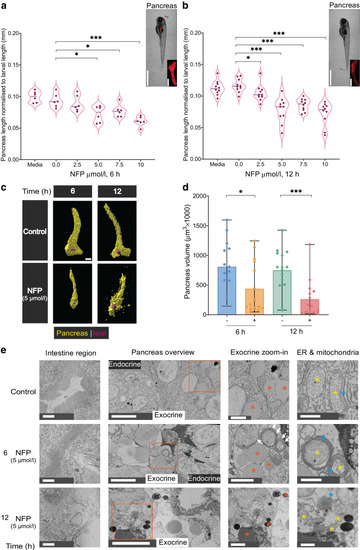
Exocrine damage induces morphological changes and reduces pancreas volume in zebrafish. (a, b) The pancreas length was measured and normalised to the whole larval length using mScarlet signal after different NFP concentrations and exposure times of 6 h (a) and 12 h (b), along with media and control (0 µmol/l NFP in 0.1% DMSO) samples (n=6 or n=10, respectively). Scale bar, 1 mm or 50 µm (magnified image). Unpaired t test was used for statistical differences between groups: *p<0.05, ***p<0.001. (c) The impact of 5 µmol/l NFP on pancreas volume in the double Tg(ela3l:ntr;insulin:gfp) line. Yellow represents mScarlet signal in pancreas; magenta represents the islet portion. Scale bar, 50 µm. (d) Bar plots showing the changes in pancreas volume (µm3) post-NFP treatment (n=15 each). Data represent the mean values with bars indicating the range from the maximum to the minimum data points. Mann–Whitney U test was used for statistical differences between groups: *p<0.05, ***p<0.001. (e) Electron microscopy images showing ultrastructural alterations within the intestine and pancreas region; the exocrine magnification (zoom-in) and ER and mitochondria images indicate different cellular structural abnormalities (granules, ER whorls, distorted mitochondria) in Tg(ela3l:ntr). Orange asterisks indicate exocrine granules; blue asterisks indicate ER; white arrows indicate ER whorls; yellow asterisks indicate mitochondria. Scale bar, 2 µm (intestine and exocrine zoom-in), 5 µm (pancreas overview) and 1 µm (ER and mitochondria). Full electron microscopy data are available via http://www.nanotomy.org/OA/Faraj2025Diabetologia/ and at the BioImage Archive (S-BIAD1479, DOI: https://doi.org/10.6019/S-BIAD1479)
|
