IMAGE

Fig. 5

ID
ZDB-IMAGE-250714-101
Source
Figures for Faraj et al., 2025
Image
Figure Caption

Fig. 5

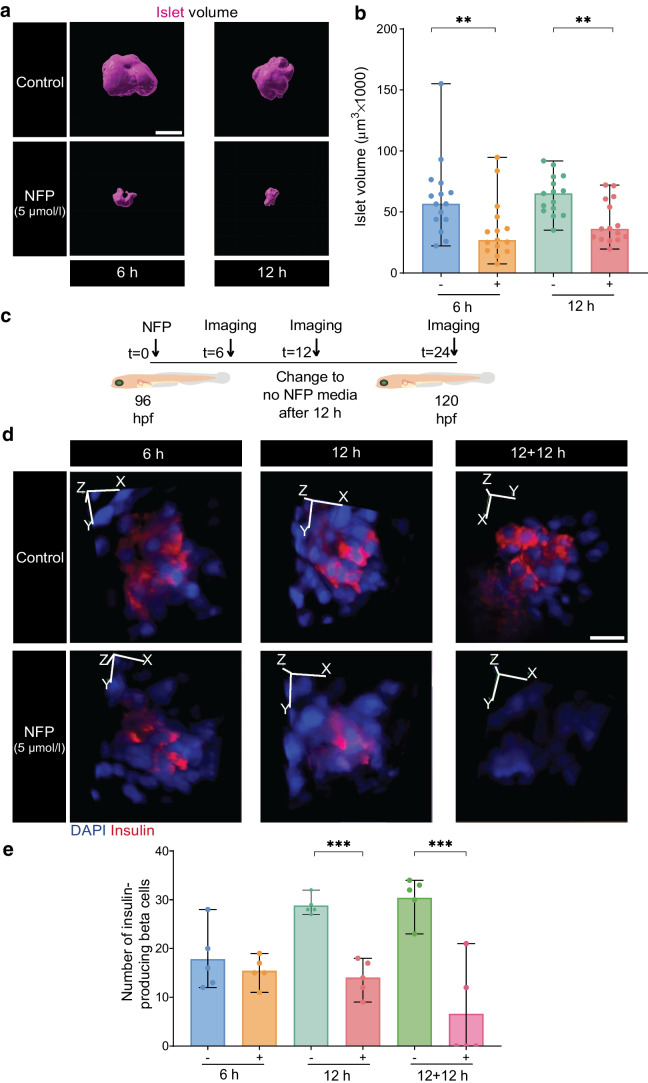
Reduced islet volume and decreased numbers of insulin-producing beta cells following exocrine damage. (a) 3D reconstruction of GFP+ beta cells and the islet volume measurement after 5 µmol/l NFP treatment. Scale bar, 25 µm. (b) Bar blots demonstrating the impact of NFP on the islet volume in Tg(ela3l:ntr;insulin:gfp) larvae (n=15 each). Data represent the mean values with bars indicating the range from the maximum to the minimum data points. Mann–Whitney U test was used for statistical differences between groups: **p<0.01. (c) Experimental schematic for imaging insulin-labelled Tg(ela3l:ntr;insulin:gfp) at 96 hpf after 6 and 12 h of NFP treatment followed by 12 h of medium without NFP (recovery time). (d, e) 3D reconstruction of insulin immunofluorescent staining and DAPI staining at 120 hpf in whole larvae following NFP treatment (n=5). Scale bar, 100 µm. Data represent the median values with bars indicating the range from the maximum to the minimum data points. Unpaired t test was used for statistical differences between groups:, ***p<0.001. Fig. 5c is created in BioRender. Faraj, N. (2025) https://BioRender.com/g20u364

Acknowledgments
This image is the copyrighted work of the attributed author or publisher, and ZFIN has permission only to display this image to its users. Additional permissions should be obtained from the applicable author or publisher of the image. Full text @ Diabetologia