IMAGE

Fig. 1

ID
ZDB-IMAGE-250714-97
Source
Figures for Faraj et al., 2025
Image
Figure Caption

Fig. 1

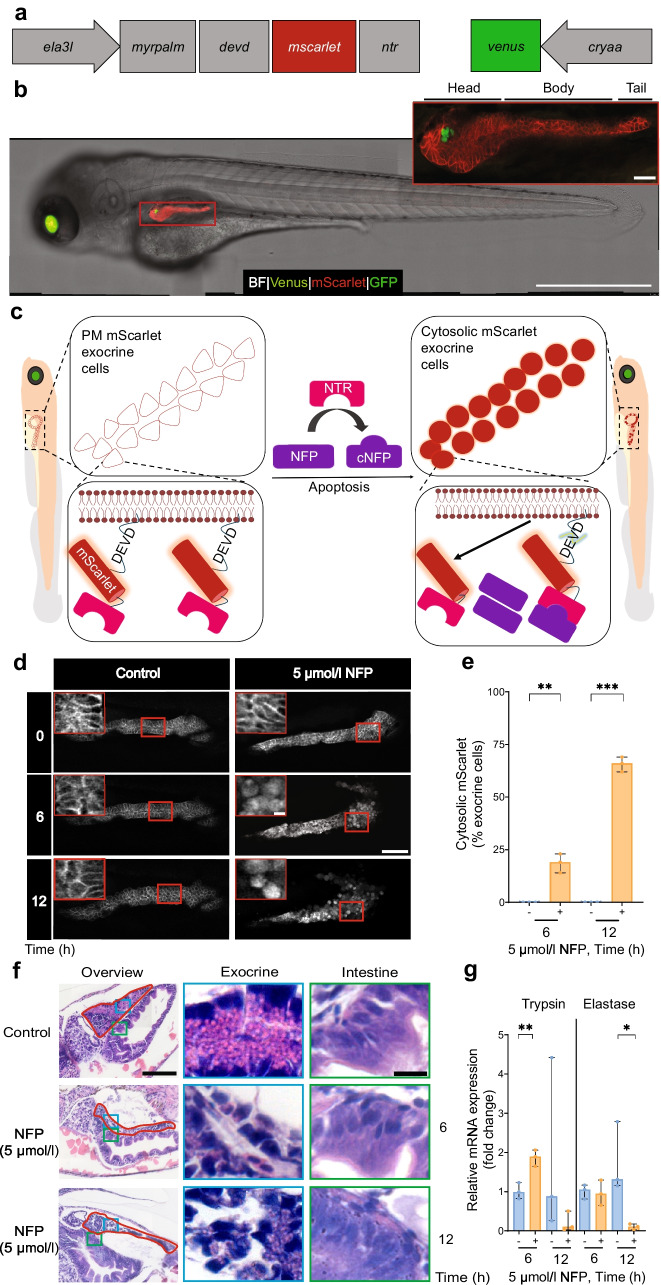
Modulation of exocrine damage in a transgenic zebrafish. (a) Schematic of the transgene cloned into the Tol2 plasmid to generate the Tg(ela3l:myrpalmdevd-mscarlet-ntr;cryaa:venus) zebrafish, Tg(ela3l:ntr). NTR-mScarlet is exclusively targeted to all exocrine plasma membranes through a short myristylation and palmitoylation sequence (myrpalm), under control of the elastase A promoter. A devd caspase cleavage site sequence is located in between myrpalm and mscarlet-ntr. Additionally, venus under control of the cryaa promoter is included for selection of transgenic zebrafish. (b) Representative example of the presence of mScarlet+ exocrine plasma membrane, Venus+ lens and GFP+ beta cells in double Tg(ela3l-ntr;insulin:gfp) zebrafish larvae at 108 hpf. Scale bar, 1 mm. The magnified image shows mScarlet signal in the three different pancreas portions: head, body and tail, surrounding GFP+ beta cells. Scale bar, 50 µm. (c) The genetic/chemical NTR–NFP modulation approach. After NFP administration, NTR enzyme transforms NFP into the cytotoxic agent cNFP, leading to apoptosis and caspase activation shown by the translocation of mScarlet from the exocrine plasma membrane to the cytosol. (d) Confocal images of mScarlet signal, showing the translocation of mScarlet after 5 µmol/l NFP on NTR+ exocrine cells over time; control: 0 µmol/l NFP in 0.1% DMSO. Scale bar, 50 μm or 5 µm (magnified image). (e) Cytosolic mScarlet+ exocrine cell percentage in response to the induced exocrine damage caused by 5 µmol/l NFP treatment (n=3 each). (f) H&E staining of larvae sections showing morphological changes of exocrine cells post-damage. Red lines indicate the pancreas, blue boxes indicate the exocrine regions and green boxes indicate the intestinal regions as control (n=6 per group). Scale bar, 100 µm or 10 µm (magnified image). (g) qPCR analysis of pooled samples of zebrafish larvae showing normalised relative mRNA expression levels of elastase and trypsin with 5 µmol/l NFP (n=3). Data represent the median values with bars indicating the range from the maximum to the minimum data points. Unpaired t test was used for statistical differences between groups. *p<0.05, **p<0.01, ***p<0.001. Fig. 1c is created in BioRender. Faraj, N. (2025) https://BioRender.com/d22a265. PM, plasma membrane

Acknowledgments
This image is the copyrighted work of the attributed author or publisher, and ZFIN has permission only to display this image to its users. Additional permissions should be obtained from the applicable author or publisher of the image. Full text @ Diabetologia