FIGURE SUMMARY
Title

Border-zone cardiomyocytes and macrophages regulate extracellular matrix remodeling to promote cardiomyocyte protrusion during cardiac regeneration

Authors
Constanty, F., Wu, B., Wei, K.H., Lin, I.T., Dallmann, J., Guenther, S., Lautenschlaeger, T., Priya, R., Lai, S.L., Stainier, D.Y.R., Beisaw, A.
Source
Full text @ Nat. Commun.

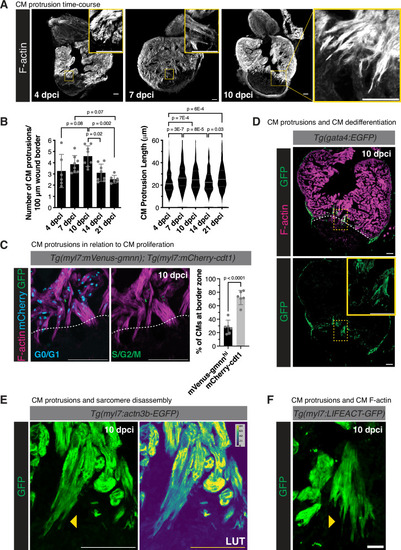
Characterization of CM protrusion into the injured area during zebrafish heart regeneration.

A Phalloidin staining of F-actin in thick cryosections of zebrafish ventricles at 4, 7, and 10 days post cryoinjury (dpci). Yellow box denotes the zoomed image from the wound border zone. B Quantification of the number of CM protrusions per 100 micron of wound border (left) and length of CM protrusions (right) from thick cryosections of adult ventricles at 4 (n = 6 ventricles), 7 (n = 8 ventricles), 10 (n = 8 ventricles), 14 (n = 8 ventricles), and 21 (n = 6 ventricles) dpci. Length of CM protrusions were quantified at 4 (n = 245 CM protrusions from 6 ventricles), 7 (n = 323 CM protrusions from 8 ventricles), 10 (n = 449 CM protrusions from 8 ventricles), 14 (n = 300 CM protrusions from 8 ventricles), and 21 (n = 248 CM protrusions from 6 ventricles) dpci. Data are presented as mean ± SD (number of CM protrusions) and violin plots of all points with solid gray lines indicating the median and dotted gray lines indicating 25th and 75th percentile (length of CM protrusions). P-values were calculated using one-way ANOVA with Tukey’s multiple comparisons test (number of CM protrusions) and the Kruskal–Wallis test with Dunnett’s multiple comparisons test (CM protrusion length). Source data are presented in the Source Data file. C Immunostaining of GFP, mCherry, and F-actin in Tg(myl7:mVenus-gmnn); Tg(myl7:mCherry-cdt1) ventricles at 10 dpci. White dashed line indicates the injury border. The percentages of mVenus-Gmnnhi and mCherry-Cdt1+ CM nuclei directly neighboring the wound border (n = 6 ventricles) were quantified on the right. Data are presented as mean ± SD. P-value was calculated using an unpaired two-sided t-test. Source data are presented in the Source Data file. D GFP and Phalloidin staining of Tg(gata4:EGFP) ventricles at 10 dpci. White dashed line indicates the injury border and the yellow box denotes the zoomed image from the wound border zone. E GFP staining in Tg(myl7:actn3b-EGFP) ventricles at 10 dpci marking the CM sarcomere. LUT (look-up table) images depict GFP intensity color-coded according to the scale within the image. Yellow arrowheads point to CM protrusions devoid of organized sarcomere structures. F GFP staining of Tg(myl7:LIFEACT-GFP) ventricles at 10 dpci marking CM-specific F-actin. Yellow arrowhead points to actin-filled CM protrusions. Scale bars: 100 μm in (A, C, and D), 20 μm in (E and F).

Live-imaging of CM protrusion into the injured tissue during zebrafish heart regeneration.

A Schematic of the experiment illustrating vibratome sectioning of cryoinjured hearts, slice culture, and live imaging. Created in BioRender. Beisaw, A. (2025) https://BioRender.com/ypwjv2r. B GFP staining in thin sections of Tg(myl7:LIFEACT-GFP) (left) and Tg(myl7:actn3b-EGFP) (right) ventricles at 10 dpci. LUT (look-up table) images depict GFP intensity color-coded according to the scale within the image. The LUT is linear and covers the full range of the data. Yellow boxes denote the cortical/trabecular CM focus area of time-lapse imaging. C Time-lapse imaging of Tg(myl7:LIFEACT-GFP)+ cortical CMs at 10 dpci. Yellow arrowhead follows a CM protrusion that displays a net positive migration into the injured area and the white arrowhead follows a CM protrusion that displays a net negative migration away from the injured area (IA). D Quantification of track displacement from CM protrusions at the border zone in Tg(myl7:LIFEACT-GFP)+ cortical CMs at 10 dpci (n = 114 protrusions from 6 ventricles) and Tg(myl7:actn3b-EGFP)+ trabecular CMs at 3 (n = 76 protrusions from 5 ventricles) and 10 (n = 84 protrusions from 4 ventricles) dpci. Data are presented as violin plots of all points with solid gray lines indicating the median and dotted gray lines indicating 25th and 75th percentile. P-values were calculated using a Kruskal–Wallis test with Dunnett’s multiple comparisons test. Source data are presented in the Source Data file. E Distribution of tracked CM protrusions with a net positive displacement (> 1 μm into the injured area), net negative displacement (> 1 μm away from the injured area), or net zero displacement (<1 μm) comparing t = 0 and t = 12 h of live-imaging in Tg(myl7:LIFEACT-GFP)+ cortical CMs at 10 dpci (n = 114 protrusions from 6 ventricles) and Tg(myl7:actn3b-EGFP)+ trabecular CMs at 3 (n = 76 protrusions from 5 ventricles) and 10 (n = 84 protrusions from 4 ventricles) dpci. Source data are presented in the Source Data file. F Immunostaining of myosin heavy chain (MHC) and embryonic CMHC (embCMHC) in thin sections of a ventricle at 10 dpci. The white dotted line denotes the outline of the wound. Blue arrowheads point to cortically-located CMs and the blue line outlines the increased invasion of cortically-located CMs into the injured tissue. G Quantification of total distance traveled by tracked CM protrusions in Tg(myl7:LIFEACT-GFP)+ cortical CMs at 10 dpci (n = 114 protrusions from 6 ventricles) and Tg(myl7:actn3b-EGFP)+ trabecular CMs at 3 (n = 76 protrusions from 5 ventricles) and 10 (n = 84 protrusions from 4 ventricles) dpci. Data are presented as violin plots of all points with solid gray lines indicating the median and dotted gray lines indicating 25th and 75th percentile. P-values were calculated using a Kruskal–Wallis test with Dunnett’s multiple comparisons test. Source data are presented in the Source Data file. H Maximum speed measured in tracked CM protrusions Tg(myl7:LIFEACT-GFP)+ cortical CMs at 10 dpci (n = 114 protrusions from 6 ventricles) and Tg(myl7:actn3b-EGFP)+ trabecular CMs at 3 (n = 76 protrusions from 5 ventricles) and 10 (n = 84 protrusions from 4 ventricles) dpci. Data are presented as violin plots of all points with solid gray lines indicating the median and dotted gray lines indicating 25th and 75th percentile. P-values were calculated using a Kruskal–Wallis test with Dunnett’s multiple comparisons test. Source data are presented in the Source Data file. Scale bars: 100 μm in (B and F), 20 μm in (C).

Macrophages are closely associated with protruding CMs at the border zone.

A Immunostaining of GFP and F-actin in thick sections from Tg(mpeg1.1:NTR-YFP) ventricles at 10 dpci. White boxes denote the zoomed image from the wound border zone in (i) and (ii). B Still image from time-lapse imaging of Tg(mpeg1:EGFP); Tg(myl7:mKATE-CAAX) ventricular sections at 10 dpci. Yellow arrowheads point to mpeg1:EGFP+ cells containing myl7:mKATE-CAAX fluorescence. C Immunostaining of GFP and mScarlet in Tg(mpeg1:EGFP); Tg(myl7:lck-mScarlet) ventricles at 7 and 10 dpci. Yellow boxes denote the zoomed image from the wound border zone. D Quantification of the number of mpeg1:EGFP+ cells 50 μm proximal and distal to the wound border at 4 (n = 5 ventricles), 7 (n = 5 ventricles), 10 (n = 6 ventricles), and 14 dpci (n = 4 ventricles). Data are presented as mean ± SD. P-values were calculated using one-way ANOVA with Tukey’s multiple comparisons test. Source data are presented in the Source Data file. E Immunostaining of GFP, Tnfa, Cxcr4b, and F-actin in Tg(mpeg1:EGFP) ventricles at 10 dpci. Yellow box denotes the zoomed image from the wound border zone. F Quantification of mean Tnfa and Cxcr4b intensity (arbitrary units, arb. units) 50 μm proximal and distal to the wound border at 4 (n = 5 ventricles) and 10 (n = 7 ventricles) dpci. Data are presented as mean ± SD. P-values were calculated with unpaired two-sided t-tests. Source data are presented in the Source Data file. Gmrc1b in situ hybridization chain reaction (HCR) and immunostaining for GFP and F-actin in Tg(mpeg1:EGFP) ventricles at 10 dpci. The yellow dotted box denotes the zoomed image from the trabecular BZ and the blue dotted box denotes the zoomed image from the cortical BZ. *denotes background autofluorescence from erythrocytes. Scale bars: 100 μm in (A, C, E), and G), 20 μm in (Ai) and (Aii), (B), and zoomed images in (E and G).

Macrophages are required for CM protrusion into the injured area.

A Immunostaining of GFP and F-actin in Tg(mpeg1:EGFP) ventricles from irf8st96/st96 mutants and wild-type siblings at 10 dpci. White dotted line denotes the approximate wound border. B Quantification of mpeg1:EGFP+ cells 50 μm proximal and distal to the wound border in Tg(mpeg1:EGFP) ventricles from irf8st96/st96 mutants and wild-type siblings at 4 (n = 4 wild-type, n = 4 mutant ventricles), 7 (n = 5 wild-type, n = 5 mutant ventricles), and 10 (n = 4 wild-type, n = 5 mutant ventricles) dpci. Data are presented as mean ± SD. P-values were calculated using multiple unpaired two-sided t-tests and corrected for multiple comparisons using the Bonferroni-Dunn method. Source data are presented in the Source Data file. C Phalloidin staining of F-actin in thick cryosections of zebrafish ventricles from irf8st96/st96 mutants and wild-type siblings at 10 dpci (left). Quantification of the number of CM protrusions per 100 micron of wound border (middle) and length of CM protrusions (right) from thick cryosections of irf8st96/st96 mutant and wild-type sibling ventricles at 10 dpci (n = 485 CM protrusions from 6 wild-type ventricles, n = 240 CM protrusions from 5 mutant ventricles). Data are presented as mean ± SD (number of CM protrusions) and violin plots of all points with solid gray lines indicating the median and dotted gray lines indicating 25th and 75th percentile (length of CM protrusions). P-values were calculated using an unpaired two-sided t-test (number of CM protrusions) and a two-sided Mann–Whitney test (CM protrusion length). Source data are presented in the Source Data file. D Schematic illustrating the experimental set-up to ablate macrophages using clodronate liposomes (CL). Created in BioRender. Beisaw, A. (2025) https://BioRender.com/2iptntt. E Phalloidin staining of F-actin in thick cryosections of zebrafish ventricles treated with PBS liposomes or clodronate liposomes at 10 dpci. F Quantification of the number of CM protrusions per 100 micron of wound border (left) and length of CM protrusions (right) from thick cryosections of ventricles from PBS (n = 521 CM protrusions from 4 ventricles) and CL (n = 664 CM protrusions from 5 ventricles) treated fish at 10 dpci. Data are presented as mean ± SD (number of CM protrusions) and violin plots of all points with solid gray lines indicating the median and dotted gray lines indicating 25th and 75th percentile (CM protrusion length). P-values were calculated using an unpaired two-sided t-test (number of CM protrusions) and a two-sided Mann–Whitney test (CM protrusion length). Source data are presented in the Source Data file. PBS PBS liposomes, CL clodronate liposomes. Scale bars: 100 μm.

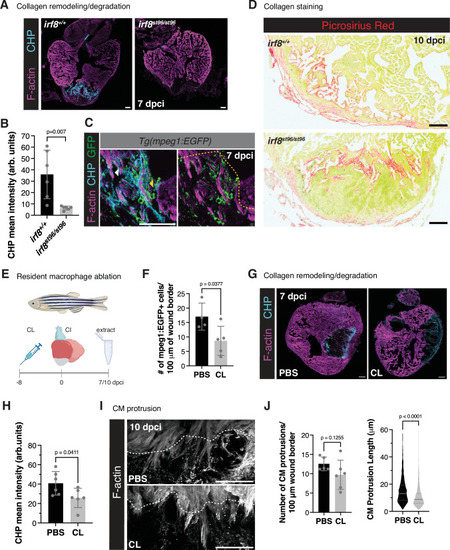
Macrophages are required for collagen remodeling at the wound border zone.

A Collagen hybridizing peptide (CHP) and F-actin staining of irf8st96/st96 mutant and wild-type sibling ventricles at 7 dpci. B Quantification of CHP intensity (arbitrary units, arb. units) at the border zone of irf8st96/st96 mutant (n = 6 ventricles) and wild-type sibling (n = 6 ventricles) at 7 dpci. Data are presented as mean ± SD. P-values were calculated using an unpaired two-sided t-test. Source data are presented in the Source Data file. C Immunostaining of GFP, CHP, and F-actin in Tg(mpeg1:EGFP) ventricles at 7 dpci. Yellow dotted lines denotes the approximate injury plane at the border zone. Yellow arrowhead points to high CHP staining at areas of CM-macrophage interaction and white arrowhead points to CHP staining at the leading edge of a protruding CM without associated macrophages. D Picrosirius red staining of collagen in irf8st96/st96 mutant and wild-type sibling ventricles at 10 dpci. E Schematic illustrating the experimental scheme to deplete resident macrophages with clodronate (CL) or PBS control liposomes. Created in BioRender. Beisaw, A. (2025) https://BioRender.com/4qhphx7. F Quantification of the number of mpeg1:EGFP+ cells 50 μm proximal and distal to the wound border in ventricles at 7 dpci in CL- (n = 5 ventricles) and PBS-liposome (n = 4 ventricles) injected fish. Data are presented as mean ± SD. P-value was calculated using an unpaired two-sided t-test. Source data are presented in the Source Data file. G Collagen hybridizing peptide (CHP) and F-actin staining of PBS control and CL-injected ventricles at 7 dpci. H Quantification of CHP intensity (arbitrary units, arb. units) at the border zone of 7 dpci ventricles in CL- (n = 6 ventricles) and PBS-liposome (n = 6 ventricles) injected fish. Data are presented as mean ± SD. P-value was calculated using an unpaired two-sided t-test. Source data are presented in the Source Data file. I Phalloidin staining of F-actin in thick cryosections of PBS liposome-injected and CL-injected zebrafish ventricles at 10 dpci. White dashed lines indicate the injury border. J Quantification of the number of CM protrusions per 100 micron of wound border (left) and length of CM protrusions (right) from thick cryosections of PBS liposome-injected (n = 598 CM protrusions from 5 ventricles) and CL-injected (n = 845 CM protrusions from 6 ventricles) zebrafish at 10 dpci. Data are presented as mean ± SD (number of CM protrusions) and violin plots of all points with solid gray lines indicating the median and dotted gray lines indicating 25th and 75th percentile (CM protrusion length). P-values were calculated using an unpaired two-sided t-test (number of CM protrusions) and a two-sided Mann–Whitney test (CM protrusion length). Source data are presented in the Source Data file. Scale bars: 100 μm.

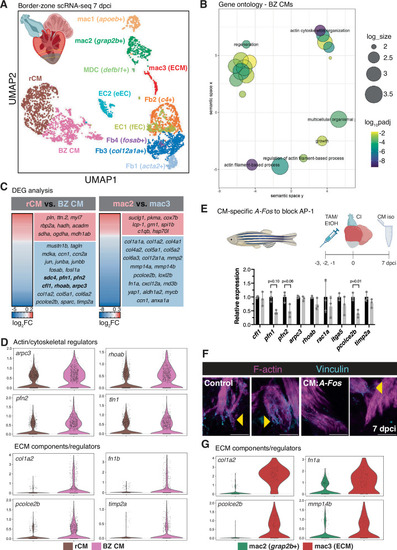
Single-cell RNA-sequencing reveals border zone-specific gene expression signatures in the regenerating heart.

A UMAP plot of scRNA-seq from 4596 cells isolated from dissected border zone regions of regenerating zebrafish hearts at 7 dpci. The microdissected region of 7 dpci ventricles used for scRNA-seq is depicted in the upper left. Created in BioRender. Beisaw, A. (2025) https://BioRender.com/zek72tx. B Gene ontology (GO) analysis of biological processes (BP) in differentially expressed genes enriched in BZ CMs compared to rCMs. log10padj was calculated in comparison to all genes in the zebrafish genome using Fisher’s exact test and corrected for multiple comparisons using the Bonferroni method. log_size corresponds to the log10(number of annotations for the GO Term ID in zebrafish from the EBI GOA Database). C Differentially expressed genes (padj < 0.05) arising from pseudo-bulk comparisons of gene expression in rCM versus BZ CMs (left) and mac2 versus mac3 (ECM, right) clusters. P-values were calculated using unpaired two-sided t-tests and corrected for multiple comparisons using the Benjamini-Hochberg method. D Violin plots of expression of genes involved in actin cytoskeleton and CM regulation in rCMs vs. BZ CMs clusters from scRNA-seq at 7 dpci. E Schematic illustrating the experimental set-up in Tg(myl7:Cre-ERT2); Tg(ubb:loxP-EGFP-loxP-AFos-P2A-tagBFP) (CM:AFos, top). Control CMs (n = 3 independent pools of 6 ventricles each) and CM:Afos CMs (n = 3 independent pools of 6 ventricles each) were isolated at 7 dpci and RT-qPCR analysis of actin cytoskeletal and ECM regulators enriched in BZ CMs was performed. Data are presented as mean ± SD. P-values were calculated using unpaired two-sided t-tests or a two-sided Mann–Whitney test (pfn1). Source data are presented in the Source Data file. Created in BioRender. Beisaw, A. (2025) https://BioRender.com/qqhzxg5. F Immunostaining of F-actin and Vinculin in control and CM:A-Fos ventricles at 7 dpci. Yellow arrowheads denote protruding CMs with Vinculin enrichment at the leading edge of protrusions. G Violin plots of expression of genes involved in ECM composition/regulation in mac3 (ECM) vs. mac2 clusters from scRNA-seq at 7 dpci. Scale bars: 20 μm.

Mmp14b is a regulator of CM protrusion.

A Collagen hybridizing peptide (CHP) and phalloidin staining of a wild-type ventricle at 10 dpci. Yellow box denotes the area in the zoomed image. B In situ hybridization of mmp14b expression in a wild-type ventricle at 7 dpci. Black dashed line denotes the approximate injury border. C Colocalization of mmp14b (HCR, magenta) with CMs (MHC immunostaining), endocardial cells (vwf HCR), macrophages (GFP immunostaining in Tg(mpeg1:EGFP) ventricles, and fibroblasts (col12a1a (HCR, green) and postnb (HCR, cyan) in the cortical BZ region at 10 dpci. Yellow box in the schematic of the heart marks the cortical CM region depicted in the zoomed images. Created in BioRender. Beisaw, A. (2025) https://BioRender.com/zek72tx. D Schematic depicting the exon structure of the mmp14b locus and CRISPR/Cas9-induced full-length deletion between exons 2 and 9 of mmp14b. Created in BioRender. Beisaw, A. (2025) https://BioRender.com/pepiu5b. E Mmp14b wild-type and putative mutant protein domain structure (left). RT-PCR of the mmp14b open reading frame from wild-type and mmp14bΔ/Δ mutant embryos (right). SP signal peptide, Pro propeptide, Cat catalytic domain, H hinge region, TM transmembrane domain, C C-terminal tail. F RT-qPCR of mmp14b and mmp14a expression in single ventricles from mmp14bΔ/Δ (n = 5 ventricles) and wild-type siblings (n = 5 ventricles) at 10 dpci. Data are presented as mean ± SD. P-values were calculated using an unpaired two-sided t-test. Source data are presented in the Source Data file. G Phalloidin staining of thick cryosections from mmp14bΔ/Δ and wild-type sibling ventricles at 10 dpci (left). Quantification of CM protrusion length (right, mmp14bΔ/Δn = 1124 CM protrusions from 8 ventricles, wild-type sibling n = 1480 CM protrusions from 9 ventricles). Data are presented as violin plots of all points with solid gray lines indicating the median and dotted gray lines indicating 25th and 75th percentile. P-values were calculated using a two-sided Mann–Whitney test. Source data are presented in the Source Data file. H Picrosirius red staining of collagen in mmp14bΔ/Δ (n = 8 ventricles) and wild-type sibling (n = 10 ventricles) at 60 dpci (left). Quantification of scar area (% of ventricle area) on the right. Data are presented as mean ± SD. P-value was calculated using an unpaired two-sided t-test. Source data are presented in the Source Data file. I Quantification of CM proliferation within 100 μm of the wound border from PCNA/Mef2 immunostaining in mmp14bΔ/Δ (n = 3 ventricles) and wild-type sibling (n = 4 ventricles) at 7 dpci. Data are presented as mean ± SD. P-value was calculated using an unpaired two-sided t-test. Source data are presented in the Source Data file. Scale bars: 100 μm in (A, B, G, and H), 20 μm in zoomed image in (A and C).

Mmp14b is essential for macrophage presence and ECM remodeling at the border zone.

A Collagen hybridizing peptide (CHP) and mScarlet immunostaining in Tg(mpeg1:EGFP); Tg(myl7:lck-mScarlet) ventricles from mmp14bΔ/Δ and wild-type siblings at 10 dpci. White dashed lines indicate the wound border and yellow boxes contain zoomed images from the wound border zone. B Quantification of CHP intensity at the border zone (arb. units, arbitrary units) in Tg(mpeg1:EGFP); Tg(myl7:lck-mScarlet) ventricles from mmp14bΔ/Δ (n = 5 ventricles) and wild-type siblings (n = 4 ventricles) at 10 dpci. Data are presented as mean ± SD. P-value was calculated using an unpaired two-sided t-test. Source data are presented in the Source Data file. C GFP and mScarlet immunostaining in Tg(mpeg1:EGFP); Tg(myl7:lck-mScarlet) ventricles from mmp14bΔ/Δ and wild-type siblings at 10 dpci. White dashed lines indicate the approximate wound border. D Quantification of mpeg1:EGFP+ cells 50 μm proximal and distal to the wound border in ventricles from mmp14bΔ/Δ (n = 6 ventricles) and wild-type siblings (7 dpci n = 7 ventricles, 10 dpci n = 6 ventricles) at 7 and 10 dpci. Data are presented as mean ± SD. P-values were calculated using unpaired two-sided t-tests and corrected for multiple comparisons using the Holm-Sidak method. Source data are presented in the Source Data file. E RT-qPCR analysis of fibroblast marker genes in mmp14bΔ/Δ mutant (n = 5 ventricles) and wild-type sibling (n = 5 ventricles) at 10 dpci. Data are presented as mean ± SD. P-values were calculated using an unpaired two-sided t-test or a two-sided Mann–Whitney test (col1a1a). Source data are presented in the Source Data file. Fcol12a1a in situ hybridization chain reaction (HCR) in mmp14bΔ/Δ mutant and wild-type sibling ventricles at 10 dpci. Yellow boxes denote zoomed images at the cortical BZ, blue boxes denote zoomed images at the apex of the wound. Epi, epicardium. Scale bars: 100 μm, 20 μm in the zoomed images in (F).

CM-specific overexpression of <italic>mmp14b</italic> promotes CM protrusion.

A Schematic illustrating the Tg(hsp70l:loxP-EGFP-loxP-mmp14b-P2A-tagBFPHA); Tg(myl7:Cre-ERT2) line and experimental scheme to induce CM-specific overexpression of mmp14b. Created in BioRender. Beisaw, A. (2025) https://BioRender.com/ifqm2g8. B RT-qPCR of mmp14b-P2A-tagBFP (left) and mmp14b (right) in control (n = 7 ventricles) and CM:mmp14b OE (n = 8 ventricles) zebrafish at 10 dpci. Data are presented as mean ± SD. P-values were calculated using unpaired two-sided t-test (mmp14b) or a two-sided Mann–Whitney test (mmp14b-tagBFP). Source data are presented in the Source Data file. C Phalloidin staining of F-actin in thick cryosections of control and CM:mmp14b OE zebrafish ventricles at 10 dpci. D Quantification of the number of CM protrusions per 100 microns of wound border and length of CM protrusions from thick cryosections of control (n = 814 CM protrusions from 7 ventricles) and CM:mmp14b OE (n = 1431 CM protrusions from 9 ventricles) zebrafish at 10 dpci. Data are presented as mean ± SD (number of CM protrusions) and violin plots of all points with solid gray lines indicating the median and dotted gray lines indicating 25th and 75th percentile (CM protrusion length). P-values were calculated using an unpaired two-sided t-test (number of CM protrusions) and a two-sided Mann–Whitney test (CM protrusion length). Source data are presented in the Source Data file. E Myosin heavy chain immunostaining of control and CM:mmp14b OE ventricles at 21 dpci. White dashed lines denote the wound apex and yellow lines denote cortical CMs that have migrated over the wound apex. F Quantification of cortical CM coverage (% wound apex) in control (n = 7 ventricles) and CM:mmp14b OE (n = 7 ventricles) at 21 dpci. Data are presented as mean ± SD. P-value was calculated using an unpaired two-sided t-test. Source data are presented in the Source Data file. G Schematic illustrating the experimental set-up to overexpress mmp14b in CMs and ablate macrophages with clodronate liposomes. Created in BioRender. Beisaw, A. (2025) https://BioRender.com/sdatdc8. H Phalloidin staining of F-actin in thick cryosections of ventricles from CM:mmp14b OE zebrafish injected with PBS control liposomes or clodronate liposomes (CL) at 10 dpci (left). Quantification of the length of CM protrusions from thick cryosections of CM:mmp14b OE zebrafish injected with PBS control liposomes (n = 598 CM protrusions from 5 ventricles) or clodronate liposomes (CL, n = 458 CM protrusions from 3 ventricles)) at 10 dpci (right). Data are presented as violin plots of all points with solid gray lines indicating the median and dotted gray lines indicating 25th and 75th percentile. P-values were calculated using a two-sided Mann–Whitney test. Source data are presented in the Source Data file. I Myosin heavy chain (MHC) immunostaining of ventricles from control zebrafish injected with PBS liposomes and CM:mmp14b OE zebrafish injected with PBS liposomes and clodronate liposomes (CL) at 21 dpci (left). White dashed lines denote the wound apex and yellow lines denote cortical CMs that have migrated over the wound apex. Quantification of cortical CM coverage (% wound apex) in ventricles from control zebrafish injected with PBS liposomes (n = 4 ventricles) and CM:mmp14b OE zebrafish injected with PBS liposomes (n = 4 ventricles) and clodronate liposomes (CL, n = 5 ventricles) at 21 dpci (right). Data are presented as mean ± SD. P-values were calculated using ordinary one-way ANOVA and Tukey’s multiple comparisons test. Source data are presented in the Source Data file. Scale bars: 100 μm.

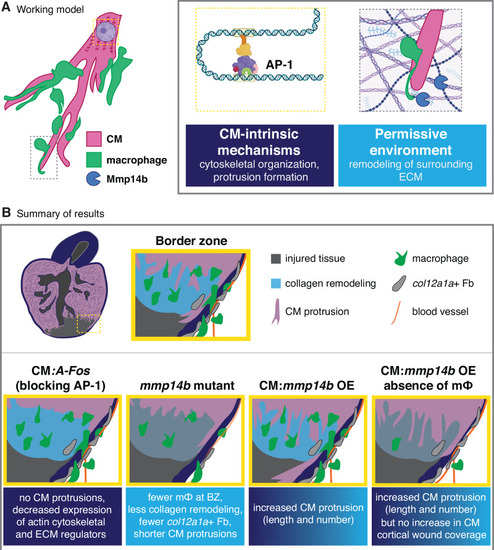
Working model and summary of our study.

A Working model of CM invasion to replace injured tissue during zebrafish heart regeneration. CM-intrinsic mechanisms, partly regulated by AP-1 transcription factors, promote actin cytoskeletal remodeling/organization and protrusion formation, while Mmp14b and macrophages contribute to remodeling the ECM at the border zone to create a permissive environment for CM invasion. Created in BioRender. Beisaw, A. (2025) https://BioRender.com/19dzxy0. B Summary of the genetic models presented in our study and their effects on CM protrusion and invasion, including CM:A-Fos to block AP-1, mmp14b deletion, CM:mmp14b OE, and CM:mmp14b OE in the absence of macrophages. The effects of mmp14b deletion on endothelial cells (blood vessels) in the model is from previously published data68. BZ border zone, CM cardiomyocyte, ECM extracellular matrix, Fb fibroblast, mϕ macrophage, OE overexpression.

Acknowledgments
This image is the copyrighted work of the attributed author or publisher, and ZFIN has permission only to display this image to its users. Additional permissions should be obtained from the applicable author or publisher of the image. Full text @ Nat. Commun.