|
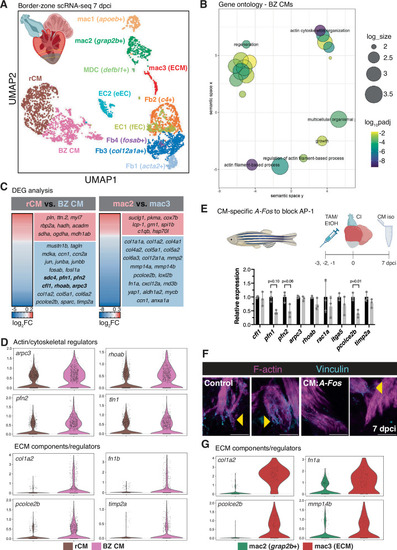
Single-cell RNA-sequencing reveals border zone-specific gene expression signatures in the regenerating heart. A UMAP plot of scRNA-seq from 4596 cells isolated from dissected border zone regions of regenerating zebrafish hearts at 7 dpci. The microdissected region of 7 dpci ventricles used for scRNA-seq is depicted in the upper left. Created in BioRender. Beisaw, A. (2025) https://BioRender.com/zek72tx. B Gene ontology (GO) analysis of biological processes (BP) in differentially expressed genes enriched in BZ CMs compared to rCMs. log10padj was calculated in comparison to all genes in the zebrafish genome using Fisher’s exact test and corrected for multiple comparisons using the Bonferroni method. log_size corresponds to the log10(number of annotations for the GO Term ID in zebrafish from the EBI GOA Database). C Differentially expressed genes (padj < 0.05) arising from pseudo-bulk comparisons of gene expression in rCM versus BZ CMs (left) and mac2 versus mac3 (ECM, right) clusters. P-values were calculated using unpaired two-sided t-tests and corrected for multiple comparisons using the Benjamini-Hochberg method. D Violin plots of expression of genes involved in actin cytoskeleton and CM regulation in rCMs vs. BZ CMs clusters from scRNA-seq at 7 dpci. E Schematic illustrating the experimental set-up in Tg(myl7:Cre-ERT2); Tg(ubb:loxP-EGFP-loxP-AFos-P2A-tagBFP) (CM:AFos, top). Control CMs (n = 3 independent pools of 6 ventricles each) and CM:Afos CMs (n = 3 independent pools of 6 ventricles each) were isolated at 7 dpci and RT-qPCR analysis of actin cytoskeletal and ECM regulators enriched in BZ CMs was performed. Data are presented as mean ± SD. P-values were calculated using unpaired two-sided t-tests or a two-sided Mann–Whitney test (pfn1). Source data are presented in the Source Data file. Created in BioRender. Beisaw, A. (2025) https://BioRender.com/qqhzxg5. F Immunostaining of F-actin and Vinculin in control and CM:A-Fos ventricles at 7 dpci. Yellow arrowheads denote protruding CMs with Vinculin enrichment at the leading edge of protrusions. G Violin plots of expression of genes involved in ECM composition/regulation in mac3 (ECM) vs. mac2 clusters from scRNA-seq at 7 dpci. Scale bars: 20 μm.
|