|
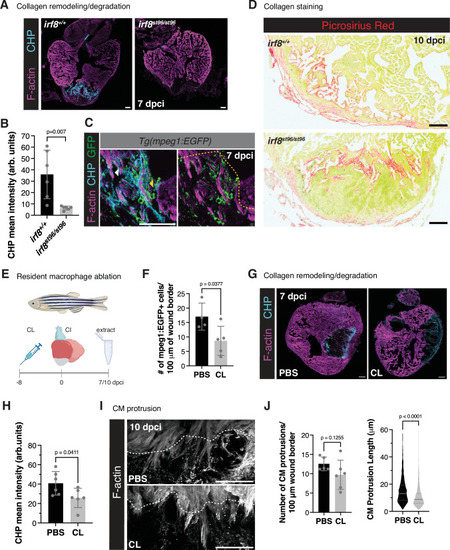
Macrophages are required for collagen remodeling at the wound border zone. A Collagen hybridizing peptide (CHP) and F-actin staining of irf8st96/st96 mutant and wild-type sibling ventricles at 7 dpci. B Quantification of CHP intensity (arbitrary units, arb. units) at the border zone of irf8st96/st96 mutant (n = 6 ventricles) and wild-type sibling (n = 6 ventricles) at 7 dpci. Data are presented as mean ± SD. P-values were calculated using an unpaired two-sided t-test. Source data are presented in the Source Data file. C Immunostaining of GFP, CHP, and F-actin in Tg(mpeg1:EGFP) ventricles at 7 dpci. Yellow dotted lines denotes the approximate injury plane at the border zone. Yellow arrowhead points to high CHP staining at areas of CM-macrophage interaction and white arrowhead points to CHP staining at the leading edge of a protruding CM without associated macrophages. D Picrosirius red staining of collagen in irf8st96/st96 mutant and wild-type sibling ventricles at 10 dpci. E Schematic illustrating the experimental scheme to deplete resident macrophages with clodronate (CL) or PBS control liposomes. Created in BioRender. Beisaw, A. (2025) https://BioRender.com/4qhphx7. F Quantification of the number of mpeg1:EGFP+ cells 50 μm proximal and distal to the wound border in ventricles at 7 dpci in CL- (n = 5 ventricles) and PBS-liposome (n = 4 ventricles) injected fish. Data are presented as mean ± SD. P-value was calculated using an unpaired two-sided t-test. Source data are presented in the Source Data file. G Collagen hybridizing peptide (CHP) and F-actin staining of PBS control and CL-injected ventricles at 7 dpci. H Quantification of CHP intensity (arbitrary units, arb. units) at the border zone of 7 dpci ventricles in CL- (n = 6 ventricles) and PBS-liposome (n = 6 ventricles) injected fish. Data are presented as mean ± SD. P-value was calculated using an unpaired two-sided t-test. Source data are presented in the Source Data file. I Phalloidin staining of F-actin in thick cryosections of PBS liposome-injected and CL-injected zebrafish ventricles at 10 dpci. White dashed lines indicate the injury border. J Quantification of the number of CM protrusions per 100 micron of wound border (left) and length of CM protrusions (right) from thick cryosections of PBS liposome-injected (n = 598 CM protrusions from 5 ventricles) and CL-injected (n = 845 CM protrusions from 6 ventricles) zebrafish at 10 dpci. Data are presented as mean ± SD (number of CM protrusions) and violin plots of all points with solid gray lines indicating the median and dotted gray lines indicating 25th and 75th percentile (CM protrusion length). P-values were calculated using an unpaired two-sided t-test (number of CM protrusions) and a two-sided Mann–Whitney test (CM protrusion length). Source data are presented in the Source Data file. Scale bars: 100 μm.
|