|
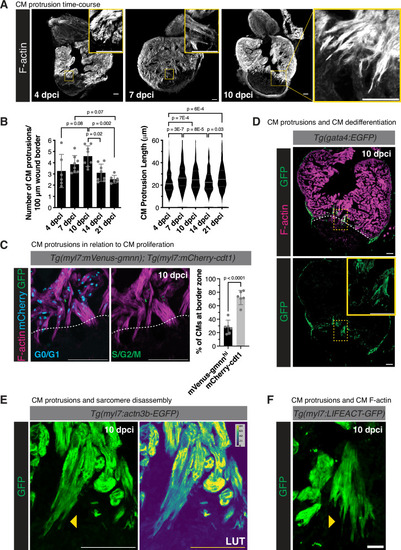
Characterization of CM protrusion into the injured area during zebrafish heart regeneration. A Phalloidin staining of F-actin in thick cryosections of zebrafish ventricles at 4, 7, and 10 days post cryoinjury (dpci). Yellow box denotes the zoomed image from the wound border zone. B Quantification of the number of CM protrusions per 100 micron of wound border (left) and length of CM protrusions (right) from thick cryosections of adult ventricles at 4 (n = 6 ventricles), 7 (n = 8 ventricles), 10 (n = 8 ventricles), 14 (n = 8 ventricles), and 21 (n = 6 ventricles) dpci. Length of CM protrusions were quantified at 4 (n = 245 CM protrusions from 6 ventricles), 7 (n = 323 CM protrusions from 8 ventricles), 10 (n = 449 CM protrusions from 8 ventricles), 14 (n = 300 CM protrusions from 8 ventricles), and 21 (n = 248 CM protrusions from 6 ventricles) dpci. Data are presented as mean ± SD (number of CM protrusions) and violin plots of all points with solid gray lines indicating the median and dotted gray lines indicating 25th and 75th percentile (length of CM protrusions). P-values were calculated using one-way ANOVA with Tukey’s multiple comparisons test (number of CM protrusions) and the Kruskal–Wallis test with Dunnett’s multiple comparisons test (CM protrusion length). Source data are presented in the Source Data file. C Immunostaining of GFP, mCherry, and F-actin in Tg(myl7:mVenus-gmnn); Tg(myl7:mCherry-cdt1) ventricles at 10 dpci. White dashed line indicates the injury border. The percentages of mVenus-Gmnnhi and mCherry-Cdt1+ CM nuclei directly neighboring the wound border (n = 6 ventricles) were quantified on the right. Data are presented as mean ± SD. P-value was calculated using an unpaired two-sided t-test. Source data are presented in the Source Data file. D GFP and Phalloidin staining of Tg(gata4:EGFP) ventricles at 10 dpci. White dashed line indicates the injury border and the yellow box denotes the zoomed image from the wound border zone. E GFP staining in Tg(myl7:actn3b-EGFP) ventricles at 10 dpci marking the CM sarcomere. LUT (look-up table) images depict GFP intensity color-coded according to the scale within the image. Yellow arrowheads point to CM protrusions devoid of organized sarcomere structures. F GFP staining of Tg(myl7:LIFEACT-GFP) ventricles at 10 dpci marking CM-specific F-actin. Yellow arrowhead points to actin-filled CM protrusions. Scale bars: 100 μm in (A, C, and D), 20 μm in (E and F).
|