
- Title
-
Nkx2.7 is a conserved regulator of craniofacial development
- Authors
- Ford, C., de Sena-Tomás, C., Wun, T.T.R., Aleman, A.G., Rangaswamy, U., Leyhr, J., Nuñez, M.I., Gao, C.Z., Nim, H.T., See, M., Coppola, U., Waxman, J.S., Ramialison, M., Haitina, T., Smeeton, J., Sanges, R., Targoff, K.L.
- Source
- Full text @ Nat. Commun.

Evolution of NK4-family genes in bilaterian animals.A Conserved microsynteny of NK4-family genes (nkx2.3, nkx2.6/7, nkx2.5, nkx2.5l) with neighboring genes from NK3 family (nkx3.1, nkx3.2, nkx3.3) and other families (cpeb2/3/4, got1/1l1, bod1/1l1, stc1/2, nkx3.1/2/3, slc25a28/37, entpd4/7, bnip1, crebrf/rfl, atp6v0e1/2). Single slashes indicate the presence of a single other gene, while a double slash indicates the presence of two or more other genes. One ancestral chromosomal locus with inferred genes was present in the vertebrate ancestor, prior to the first round (1 R) of vertebrate whole genome duplication (WGD) and two ancestral chromosomal loci with inferred genes are shown prior to the second round (2 R) of WGD. Four chromosomal loci were identified for extant vertebrate NK4-family genes: nkx2.3, nkx2.6/7 (not found in thorny skate and zebra shark), nkx2.5, and nkx2.5l (not found in investigated bony fishes). Zebrafish retained only one copy of each NK4- and NK3-family gene following 3 R, and zebrafish nkx2.7 shares the conserved synteny with vertebrate Nkx2.6. B The phylogenetic reconstruction of NK4-family genes places the tunicate Nk4 gene at the base of two nodes, one node leading to nkx2.3 and nkx2.6 subfamilies and another to nkx2.5 and nkx2.5l subfamilies. Zebrafish nkx2.7 and gar nkx2.6 cluster with the amniote Nkx2-6 genes. C Summary of whole genome duplications and NK4- and NK3-family gene losses in bilaterian animals. |

Pharyngeal arch expression of nkx2.7 is necessary for jaw formation and larval survival.In situ hybridization (ISH) for nkx2.7 in wild-type embryos at 6 so (n = 5) (A), 21 so (n = 7) (B), 26 hpf (n = 5) (C), 32 hpf (n = 5) (D), 36 hpf (n = 20) (E), and 42 hpf (n = 20) (F) demarcates progressive expression in the lateral plate mesoderm, cardiac cone, pharyngeal arch (PA) primordia, cardiac tube, and mesendoderm of the PAs throughout early development. Numbers represent PA primordia 1-6. Black arrows and white dotted lines encircling PA1 and PA2 denote mesodermal cores (C). Dorsal views, anterior to the top (A–E) and lateral view, anterior to the left (F). Scale bar, 50 μm. Hybridization chain reaction (HCR) for nkx2.7 in Tg(tcf21:nucGFP) (n = 6) (G–I) and Tg(sox17:GFP) (n = 7) (J–L) wild-type embryos. nkx2.7 and dlx2a expression is reflected through HCR in wild-type embryos (n = 12) (M–O). Insets show single plane, higher magnification images of PA2. White arrows indicate double positive cells. Lateral views, anterior to the left. Scale bar, 50 μm. P Schematic depicts the zebrafish nkx2.7vu413 allele and the predicted wild-type and mutant Nkx2.7 protein products. The vu413 point mutation generated through TILLING is noted in red with the nucleotide transversion indicated above the gene and the corresponding codon change indicated next to the protein. The C- > A transversion at position 321 of the open reading frame leads to a nonsense mutation that is predicted to cause truncation of the protein prior to the homeodomain. Q, R Representative images of 4 dpf wild-type (n = 11) (Q) and nkx2.7−/− (n = 8) (R) embryos. Red arrows highlight normal jaw development in the wild-type embryo compared to a collapsed jaw in the nkx2.7−/− embryo. Lateral view, anterior to the left. Scale bar, 200 μm. S Kaplan-Meier survival curve depicts the pattern of larval death based on genotypic assessment in wild-type (n = 225) and nkx2.7−/− (n = 74) larvae. |

Nkx2.7 is necessary for branchiomeric muscle morphogenesis. A Schematic of the BMs derived from PA1 (green) and PA2 (orange) including intermandibularis anterior (ima), intermandibularis posterior (imp), hyohyals (hh), and interhyals (ih). The heart, delineated in grey, has two chambers: ventricle (V) and atrium (A). Confocal images of MF20 (magenta) and Elnb (green) immunofluorescence designates BMs and smooth muscle of the outflow tract, respectively, of wild-type (n = 16) (B), nkx2.5−/− (n = 11) (C), nkx2.7−/− (n = 16) (D), and nkx2.5−/−;nkx2.7−/− (n = 5) (E) embryos. The extraocular muscles include the inferior oblique (io), inferior rectus (ir), and the adductor mandibulae (am) along with an additional PA-derived cephalic muscle, the sternohyoideus (sh). nkx2.5−/−;nkx2.7−/− embryos exhibit exacerbation of the PA2-derived BMs defects in comparison to nkx2.7−/− embryos, implicating partially redundant functions of nkx2.7 and nkx2.5. Ventral views, anterior to the top. Scale, 100 μm. Two-color fluorescent ISH of wild-type embryos illuminates overlapping expression of nkx2.7 (green) and nkx2.5 (magenta) in PA1-5 at 26 hpf (n = 12) (F). Higher magnification panels represent PA1 and PA2 domains (white dotted lines) in a merged (G) and single channel maximum intensity (H, I) projections. Lateral views, anterior to the left. Scale, 100 μm. J Quantification of the number of BMs derived from PAs in wild-type (n = 16), nkx2.5−/− (n = 11), nkx2.7−/− (n = 16), and nkx2.5−/−;nkx2.7−/− (n = 5) embryos. Mean and standard error of each data set are shown. Unpaired, two-tailed t-test yields statistically significant differences between wild-type and nkx2.7−/− (p < 0.0001), wild-type and nkx2.5−/−;nkx2.7−/− (p < 0.0001), and nkx2.7−/− and nkx2.5−/−;nkx2.7−/− (p = 0.0024) embryos. |
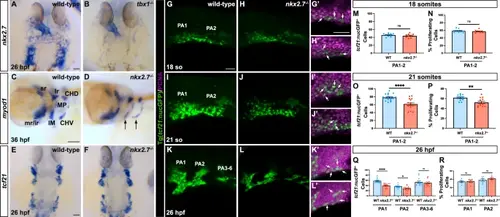
Branchiomeric muscle progenitor proliferation is disrupted in the absence of Nkx2.7. ISH for nkx2.7 in wild-type (n = 4) (A) and tbx1−/− (n = 4) (B) embryos illuminates significant loss of nkx2.7 expression in the PAs at 26 hpf. Scale bar, 50 μm. myod1 transcripts in wild-type (n = 20) (C) and nkx2.7−/− (n = 10) (D) embryos are downregulated in the Intermandibularis (IM) and the Constrictor Hyoideus Ventralis (CHV) precursors at 36 hpf. Expression of myod1 is also detected in the superior rectus (sr), lateral rectus (lr), medical rectus (mr), inferior rectus (ir), Constrictor Hyoideus Dorsalis (CHD), and the Masticatory Plate (MP). Lateral views, anterior to the left. Scale bar, 50 μm. E, F tcf21 ISH shows no overt discrepancy in pharyngeal arch expression between wild-type (n = 8) and nkx2.7−/− (n = 9) embryos. Dorsal views, anterior to the top. Scale, 50 μm. G–L Maximum projection images of confocal z-stacks of wild-type and nkx2.7−/− embryos carrying Tg(tcf21:nucGFP) demarcate the BM progenitors in the PA1, PA2, and PA3-6 (posterior arches) at 18 so (wild-type, n = 10; nkx2.7−/−, n = 9) (G,H), at 21 so (wild-type, n = 19; nkx2.7−/−, n = 17) (I, J), at 26 hpf (wild-type, n = 15; nkx2.7−/−, n = 15) (K, L). Insets show higher magnification images of PAs with PCNA immunostaining in both wild-type and nkx2.7−/− embryos, respectively, at 18 so (G’,H’), 21 so (I’,J’), and 26 hpf (K’,L’). White arrows highlight PCNA+tcf21:nucGFP+ cells. Lateral view, anterior to the left. Scale, 100 μm (G–L) and scale, 50 μm (G’-L’). M–R Quantification of BM progenitors and percentage of PCNA+ cells in specific PAs reveal no statistically significant differences in specification or proliferation in the absence of nkx2.7 at 18 so (M, N). However, a statistically significant decrement in BM progenitors is evident at 21 so, with an associated proliferative defect (p < 0.0001 for O and p = 0.0037 for P) (O, P). While the statistically significant decrease in PA1 and PA2 BM progenitors persists at 26 hpf, there is no evidence of abnormal proliferation at this timepoint (PA1, p < 0.0001; PA2, p = 0.0102) (Q, R). The number of samples for each genotype and timepoint are noted above. Mean and standard error of each data set are shown. Unpaired, two-tailed Student’s t-test is used to demonstrate statistically significance. |
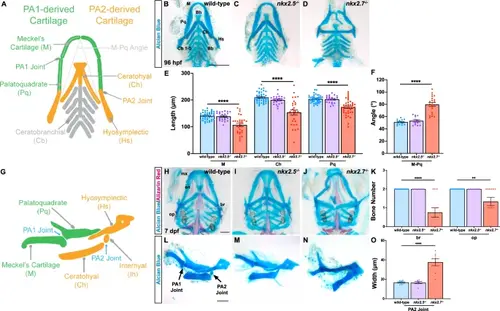
Craniofacial cartilage development requires nkx2.7 expression. A Schematic illustrates the cartilage elements derived from PA1 (green) and PA2 (orange) along with associated morphometric parameters (gray dotted lines) measured in panels E and F. Cartilages, such as ceratobranchial elements, derived from PA3-7 are noted in gray. Dissected Alcian Blue staining in wild-type (n = 21) (B), nkx2.5−/− (n = 11) (C), and nkx2.7−/− (n = 15) (D) demonstrate shorter and wider orientation of the PA1- and PA2-derived cartilages in nkx2.7−/− compared to wild-type and nkx2.5−/− embryos. Viscerocranium cartilage elements are labeled as follows: Meckel’s (M), palatoquadrate (Pq), ceratohyal (Ch), hyosymplectic (Hs), basihyal (Bh), basibranchial (Bb), and ceratobranchial (Cb). Ventral views, anterior to the top. Scale, 100 μm. E Morphometric analysis of the cartilage segments reveals statistically significant decrease in lengths between wild-type (n = 21), nkx2.5−/− (n = 11), and nkx2.7−/− (n = 15) embryos in M (p < 0.0001), Ch (p < 0.0001), and Pq (p < 0.0001), employing an unpaired, two-tailed t-test. Mean and standard error of each data set are shown. F Measurement of the M-Pq angle delineates a statistically significant difference between wild-type (n = 14) and nkx2.7−/− (n = 20) embryos with no difference detected when comparing wild-type and nkx2.5−/− (n = 13) embryos. Unpaired, two-tailed t-test is used to demonstrate mean and standard error of each data set (p < 0.0001 between wild-type and nkx2.7−/− embryos). G Schematic illustrates a lateral view (anterior to the left) of cartilage elements and joint articulations contributing to the lower jaw at 96 hpf. H–J Visualization of viscerocranium following Alcian Blue and Alizarin Red staining at 7 dpf reveals aggravation of the craniofacial abnormalities in nkx2.7−/− embryos. Craniofacial skeletal elements identified as follows: maxilla bone (mx), entopterygoid (en), branchiostegal ray (br), and opercle (op). Ventral views (anterior to the top) illuminate widening and shortening of the lower jaw in nkx2.7−/− (n = 7) (J) compared with wild-type (n = 35) (H) and nkx2.5−/− (n = 16) (I) embryos. Scale, 100 μm. K Quantification of the statistically significant decline in br and op bones when evaluating wild-type and nkx2.5−/− compared with nkx2.7−/− embryos using an unpaired, two-tailed t-test (br, p < 0.0001; op, p = 0.0019). The number of samples for each genotype is noted above. Mean and standard error of each data set are shown. L–N Lateral views (anterior to the left) of dissected wild-type (n = 9) (L), nkx2.5−/− (n = 7), and nkx2.7−/− (n = 8) (N) embryos following Alcian Blue staining. PA2 jaw joint fusion with thickening of the connection between the ceratohyal and the hyosymplectic cartilages is visible in the loss-of-function model. Scale, 100 μm. O Quantification of the statistically significant enlargement in the Ch width at the juncture of the PA2 joint in nkx2.7−/− compared to wild-type embryos employing an unpaired, two-tailed t-test (p < 0.0001). The number of samples for each genotype is noted above. Mean and standard error of each data set are shown. |
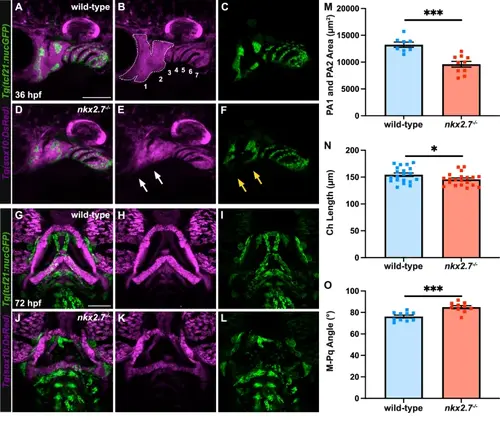
Ventral neural crest domains of the anterior pharyngeal arches fail to form in nkx2.7−/− embryos. A–F Maximum projection images of confocal z-stacks of wild-type (n = 8) and nkx2.7−/− (n = 10) embryos carrying Tg(sox10:DsRed) and Tg(tcf21:nucGFP) highlight loss of ventral neural crest domains of PA1 and PA2 in the absence of nkx2.7 at 36 hpf. White dotted lines circumscribe PA1 and PA2 CNCC domains. Numbers represent CNCC domains derived from PA1-7. White arrows indicate deficient CNCCs in the ventral domains. Yellow arrows underscore a parallel shortage of the ventral mesoderm populations labeled with Tg(tcf21:nucGFP). Lateral views, anterior to the left. Scale, 50 μm. G–L Images of the same animals at 72 hpf underscore that the absence of ventral neural crest domains result in dysmorphic PA1- and PA2-derived cartilages in nkx2.7−/− (n = 15) and wild-type (n = 14) embryos. Correspondingly, dysmorphic BM are visualized with Tg(tcf21:nucGFP) in nkx2.7−/− embryos. Ventral views, anterior to the top. Scale, 100 μm. M Quantification of the area occupied by PA1 and PA2 CNCC lineage is measured indicating a statistically significant difference between wild-type and nkx2.7−/− embryos at 36 hpf using an unpaired, two-tailed t-test (p = 0.0002). Mean and standard error of each data set are shown. N, O Measurements of Ch lengths and M-Pq angles demonstrate a statistically significant difference between wild-type and nkx2.7−/− embryos at 72 hpf using an unpaired, two-tailed t-test (Ch Length, p = 0.0431; M-Pq Angle, p = 0.0003). Mean and standard error of each data set are shown. |
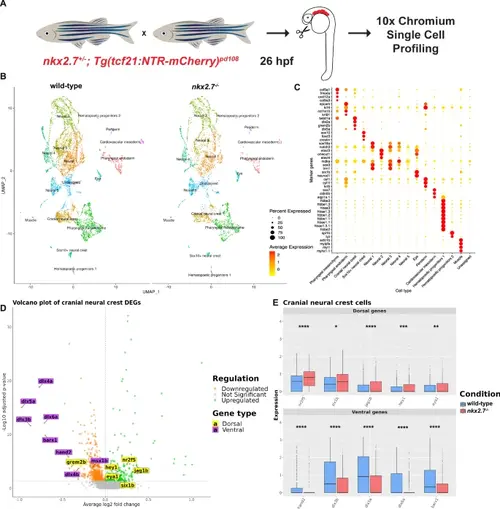
Single-cell RNA-sequencing of pharyngeal arches uncovers misregulation of dorsal and ventral CNCC transcripts in nkx2.7−/− embryos. A Schematic portrays the approach for generation of the scRNA-seq data. Micro-dissected tissue from PAs of wild-type and nkx2.7−/− embryos carrying Tg(tcf21:NTR-mCherry) were submitted for scRNA sequencing at 26 hpf. B UMAP of low-resolution clusters for wild-type and nkx2.7−/− samples. C Expression matrix demonstrates genes that are used to classify the 16 different clusters. D Volcano plot compares the transcript expression in the cranial neural crest cluster in wild-type and nkx2.7−/− embryos. Green dots represent significantly upregulated genes and orange dots represent downregulated genes (FDR-adjusted p-value < 0.05). Genes labeled in yellow are dorsal CNCC genes and those in purple are ventral CNCC genes. E Box plots indicate statistically significant upregulation of dorsal CNCC genes (nr2f5, six1b, jag1b, hey1, and eya1) and statistically significant downregulation of ventral CNCC genes (hand2, dlx3b, dlx5a, dlx6a, and barx1) when comparing wild-type and nkx2.7−/− embryos in the cranial neural crest cluster. Wilcoxon Rank Sum Test was used to evaluate the expression levels of the pooled cells from two embryos in each genotype. Calculations are based on 1078 cells from the cranial neural crest clusters (642 wild-type and 436 nkx2.7−/− cells). The boxes delimit the lower quartile (Q1) and upper quartile (Q3) of the distribution of the expression levels; the tick line within the boxes represents the median (Q2) value. Whiskers are extended to 1.5 Å~ interquartile range (Q3 - Q1) and outliers are represented as single points. The significance levels (nr2f5, p < 0.0001; six1b, p = 0.0203; jag1b, p < 0.0001; hey1, p = 0.0005; eya1, p = 0.0021; hand2, p < 0.0001; dlx3b, p < 0.0001; dlx5a, p < 0.0001; dlx6a, p < 0.0001; barx1, p < 0.0001) indicate the FDR-adjusted p-values from the statistical test. |
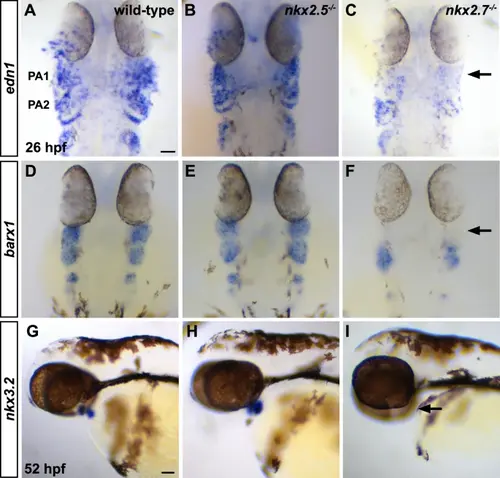
Nkx2.7 is required for dorsal-ventral patterning of PA domains. A–F ISH for edn1 and barx1 at 26 hpf demonstrates decreased expression of each respective ventral gene in PA1 of nkx2.7−/− (n = 17 and 13, respectively) compared to wild-type (n = 26 and 22, respectively) and nkx2.5−/− (n = 11 and 11, respectively) embryos. Black arrows point to significantly diminished expression of each gene in PA1. Dorsal views, anterior to the top. Scale bar, 50 μm. G–I nkx3.2 is expressed in the first arch mesenchyme and pharyngeal endoderm in wild-type (n = 34) and nkx2.5−/− (n = 24) embryos at 52 hpf. However, its expression is eradicated in the pharyngeal arches of nkx2.7−/− embryos (n = 20). Black arrow points to significantly diminished expression in PA1. Lateral views, anterior to the left. Scale bar, 50 μm. |
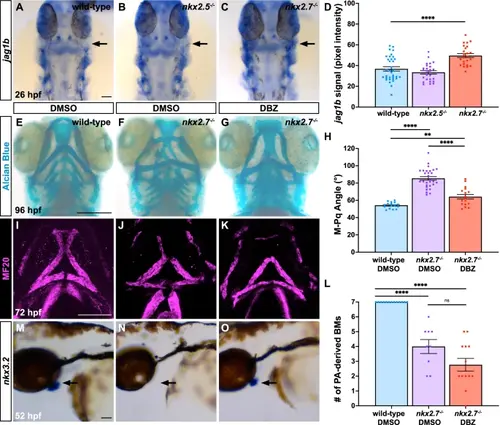
Notch signaling is repressed by Nkx2.7 in patterning craniofacial cartilage and joints. ISH for jag1b at 26 hpf indicates enhanced expression (black arrow) in PA1 of nkx2.7−/− (n = 12) (C) compared to wild-type (n = 17) (A) and nkx2.5−/− (n = 15) (B) embryos. Dorsal views, anterior to the top. Scale bar, 50 μm. D Quantification of jag1b signal, detected by ISH, reveals statistically significant augmentation in PA1 in nkx2.7−/− compared to wild-type and nkx2.5−/− embryos (p < 0.0001). Mean and standard error of each data set are shown with analysis performed using an unpaired, two-tailed Student’s t-test. Alcian Blue staining in DMSO-exposed wild-type (n = 21) (E) and nkx2.7−/− (n = 26) (F) embryos and in DBZ-exposed nkx2.7−/− (n = 30) (G) embryos highlights lengthening and narrowing of anterior PA-derived cartilage elements in DBZ-exposed nkx2.7−/− embryos compared to DMSO-exposed wild-type and nkx2.7−/− embryos. Ventral views, anterior to the top. Scale, 100 μm. H Measurement of the M-Pq angle in embryos stained with Alcian Blue delineates a statistically significant decrease in the DBZ-exposed (n = 18) compared to the DMSO-exposed (n = 26) nkx2.7−/− embryos indicating a partial rescue towards the angle displayed in the DMSO-exposed wild-type embryos (n = 26). Mean and standard error of each data set are shown. Unpaired, two-tailed Student’s t-test yields p < 0.0001 between DMSO-exposed wild-type and nkx2.7−/− embryos, p = 0.0013 between DMSO-exposed wild-type and DBZ-exposed nkx2.7−/− embryos, and p < 0.0001 between DMSO-exposed and DBZ-exposed nkx2.7−/− embryos. I–L MF20 immunofluorescence depicts BMs in DMSO-exposed wild-type (n = 22) (I) and nkx2.7−/− (n = 18) (J) embryos and in DBZ-exposed nkx2.7−/− (n = 19) (K) embryos. No statistically significant difference in the number of PA-derived BMs is observed between DMSO- and DBZ-exposed nkx2.7−/− embryos employing an unpaired, two-tailed Student’s t-test. Ventral views, anterior to the top. Scale, 100 μm. M–O ISH for nkx3.2 at 52 hpf demonstrates reappearance of expression in PA1 of DBZ-exposed nkx2.7−/− (n = 9/9) (O) compared to DMSO-exposed nkx2.7−/− (n = 7/9) (N) embryos. Moreover, comparable expression domains are evident in DMSO-exposed wild-type embryos (n = 10/10) (M) and DBZ-exposed nkx2.7−/− embryos (O). Dorsal views, anterior to the top. Scale bar, 50 μm. |