
|
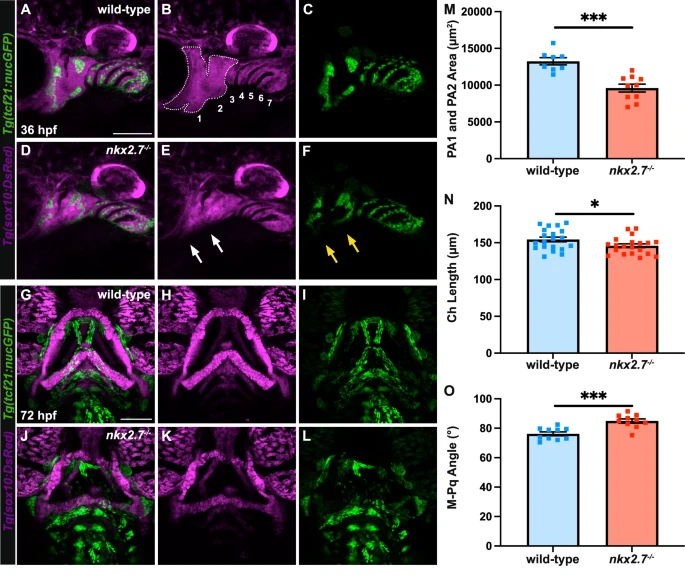
Fig. 6 Ventral neural crest domains of the anterior pharyngeal arches fail to form in nkx2.7−/− embryos. A–F Maximum projection images of confocal z-stacks of wild-type (n = 8) and nkx2.7−/− (n = 10) embryos carrying Tg(sox10:DsRed) and Tg(tcf21:nucGFP) highlight loss of ventral neural crest domains of PA1 and PA2 in the absence of nkx2.7 at 36 hpf. White dotted lines circumscribe PA1 and PA2 CNCC domains. Numbers represent CNCC domains derived from PA1-7. White arrows indicate deficient CNCCs in the ventral domains. Yellow arrows underscore a parallel shortage of the ventral mesoderm populations labeled with Tg(tcf21:nucGFP). Lateral views, anterior to the left. Scale, 50 μm. G–L Images of the same animals at 72 hpf underscore that the absence of ventral neural crest domains result in dysmorphic PA1- and PA2-derived cartilages in nkx2.7−/− (n = 15) and wild-type (n = 14) embryos. Correspondingly, dysmorphic BM are visualized with Tg(tcf21:nucGFP) in nkx2.7−/− embryos. Ventral views, anterior to the top. Scale, 100 μm. M Quantification of the area occupied by PA1 and PA2 CNCC lineage is measured indicating a statistically significant difference between wild-type and nkx2.7−/− embryos at 36 hpf using an unpaired, two-tailed t-test (p = 0.0002). Mean and standard error of each data set are shown. N, O Measurements of Ch lengths and M-Pq angles demonstrate a statistically significant difference between wild-type and nkx2.7−/− embryos at 72 hpf using an unpaired, two-tailed t-test (Ch Length, p = 0.0431; M-Pq Angle, p = 0.0003). Mean and standard error of each data set are shown.