
|
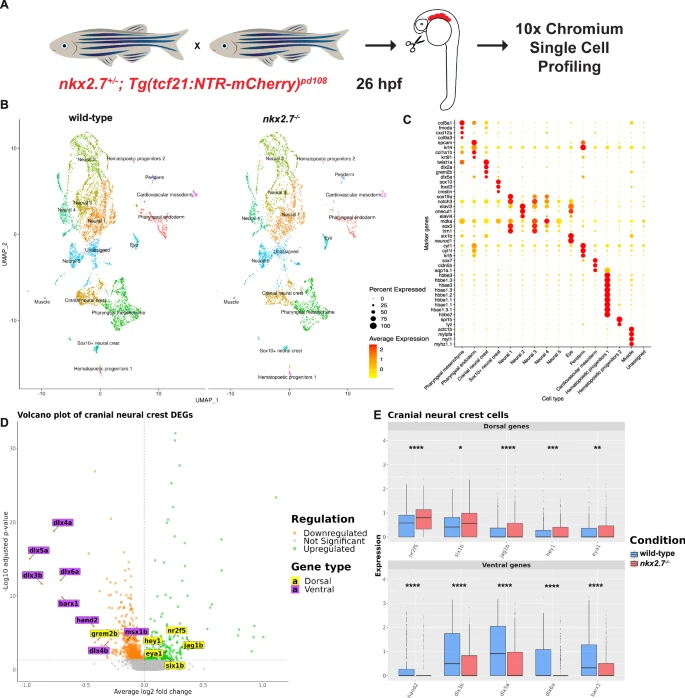
Fig. 7 Single-cell RNA-sequencing of pharyngeal arches uncovers misregulation of dorsal and ventral CNCC transcripts in nkx2.7−/− embryos. A Schematic portrays the approach for generation of the scRNA-seq data. Micro-dissected tissue from PAs of wild-type and nkx2.7−/− embryos carrying Tg(tcf21:NTR-mCherry) were submitted for scRNA sequencing at 26 hpf. B UMAP of low-resolution clusters for wild-type and nkx2.7−/− samples. C Expression matrix demonstrates genes that are used to classify the 16 different clusters. D Volcano plot compares the transcript expression in the cranial neural crest cluster in wild-type and nkx2.7−/− embryos. Green dots represent significantly upregulated genes and orange dots represent downregulated genes (FDR-adjusted p-value < 0.05). Genes labeled in yellow are dorsal CNCC genes and those in purple are ventral CNCC genes. E Box plots indicate statistically significant upregulation of dorsal CNCC genes (nr2f5, six1b, jag1b, hey1, and eya1) and statistically significant downregulation of ventral CNCC genes (hand2, dlx3b, dlx5a, dlx6a, and barx1) when comparing wild-type and nkx2.7−/− embryos in the cranial neural crest cluster. Wilcoxon Rank Sum Test was used to evaluate the expression levels of the pooled cells from two embryos in each genotype. Calculations are based on 1078 cells from the cranial neural crest clusters (642 wild-type and 436 nkx2.7−/− cells). The boxes delimit the lower quartile (Q1) and upper quartile (Q3) of the distribution of the expression levels; the tick line within the boxes represents the median (Q2) value. Whiskers are extended to 1.5 Å~ interquartile range (Q3 - Q1) and outliers are represented as single points. The significance levels (nr2f5, p < 0.0001; six1b, p = 0.0203; jag1b, p < 0.0001; hey1, p = 0.0005; eya1, p = 0.0021; hand2, p < 0.0001; dlx3b, p < 0.0001; dlx5a, p < 0.0001; dlx6a, p < 0.0001; barx1, p < 0.0001) indicate the FDR-adjusted p-values from the statistical test.