
Fig. 9
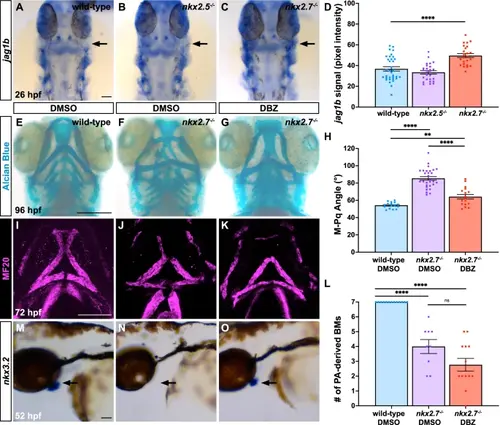
Notch signaling is repressed by Nkx2.7 in patterning craniofacial cartilage and joints. ISH for jag1b at 26 hpf indicates enhanced expression (black arrow) in PA1 of nkx2.7−/− (n = 12) (C) compared to wild-type (n = 17) (A) and nkx2.5−/− (n = 15) (B) embryos. Dorsal views, anterior to the top. Scale bar, 50 μm. D Quantification of jag1b signal, detected by ISH, reveals statistically significant augmentation in PA1 in nkx2.7−/− compared to wild-type and nkx2.5−/− embryos (p < 0.0001). Mean and standard error of each data set are shown with analysis performed using an unpaired, two-tailed Student’s t-test. Alcian Blue staining in DMSO-exposed wild-type (n = 21) (E) and nkx2.7−/− (n = 26) (F) embryos and in DBZ-exposed nkx2.7−/− (n = 30) (G) embryos highlights lengthening and narrowing of anterior PA-derived cartilage elements in DBZ-exposed nkx2.7−/− embryos compared to DMSO-exposed wild-type and nkx2.7−/− embryos. Ventral views, anterior to the top. Scale, 100 μm. H Measurement of the M-Pq angle in embryos stained with Alcian Blue delineates a statistically significant decrease in the DBZ-exposed (n = 18) compared to the DMSO-exposed (n = 26) nkx2.7−/− embryos indicating a partial rescue towards the angle displayed in the DMSO-exposed wild-type embryos (n = 26). Mean and standard error of each data set are shown. Unpaired, two-tailed Student’s t-test yields p < 0.0001 between DMSO-exposed wild-type and nkx2.7−/− embryos, p = 0.0013 between DMSO-exposed wild-type and DBZ-exposed nkx2.7−/− embryos, and p < 0.0001 between DMSO-exposed and DBZ-exposed nkx2.7−/− embryos. I–L MF20 immunofluorescence depicts BMs in DMSO-exposed wild-type (n = 22) (I) and nkx2.7−/− (n = 18) (J) embryos and in DBZ-exposed nkx2.7−/− (n = 19) (K) embryos. No statistically significant difference in the number of PA-derived BMs is observed between DMSO- and DBZ-exposed nkx2.7−/− embryos employing an unpaired, two-tailed Student’s t-test. Ventral views, anterior to the top. Scale, 100 μm. M–O ISH for nkx3.2 at 52 hpf demonstrates reappearance of expression in PA1 of DBZ-exposed nkx2.7−/− (n = 9/9) (O) compared to DMSO-exposed nkx2.7−/− (n = 7/9) (N) embryos. Moreover, comparable expression domains are evident in DMSO-exposed wild-type embryos (n = 10/10) (M) and DBZ-exposed nkx2.7−/− embryos (O). Dorsal views, anterior to the top. Scale bar, 50 μm. |